模块:INFRA
1 - 系统架构
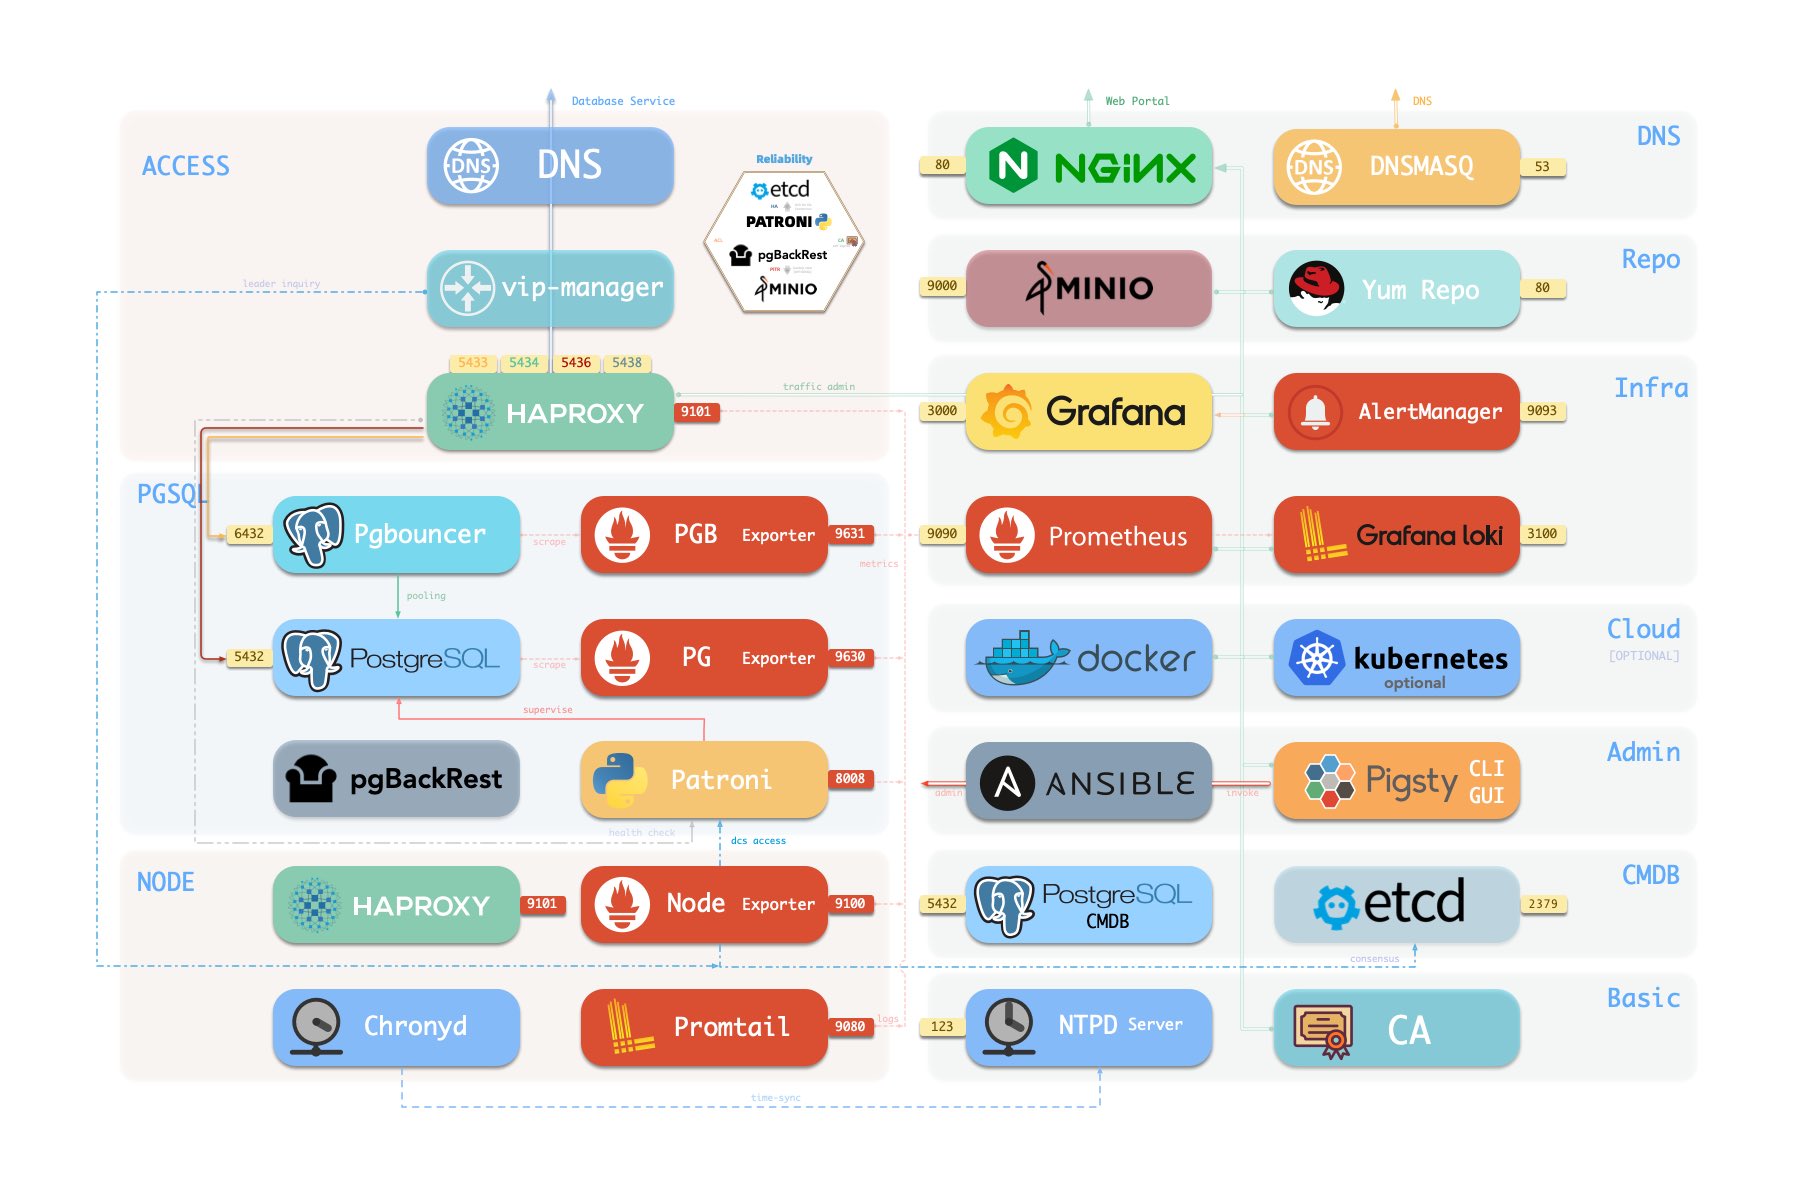
一套标准的 Pigsty 部署会带有一个 INFRA 模块,为纳管的节点与数据库集群提供服务:
- Nginx:作为 Web 服务器,提供本地软件仓库服务;作为反向代理,统一收拢其他 Web UI 服务的访问
- Grafana:可视化平台,呈现监控指标,展现面板大屏,或者进行数据分析与可视化。
- Loki:集中收集存储日志,便于从 Grafana 中查询。
- Prometheus:监控时序数据库,拉取监控指标,存储监控数据,计算报警规则。
- AlertManager:聚合告警事件,分发告警通知,告警屏蔽与管理。
- PushGateway:收集一次性任务/跑批任务的监控指标
- BlackboxExporter:探测各个节点 IP 与 VIP 地址的可达性
- DNSMASQ:提供 DNS 解析服务,解析 Pigsty 内部使用到的域名
- Chronyd:提供 NTP 时间同步服务,确保所有节点时间一致
INFRA 模块对于高可用 PostgreSQL 并非必选项,例如在 精简安装 模式下,就不会安装 Infra 模块。
但 INFRA 模块提供了运行生产级高可用 PostgreSQL 集群所需要的支持性服务,通常强烈建议安装启用。
如果您已经有自己的基础设施(Nginx,本地仓库,监控系统,DNS,NTP),您也可以停用 INFRA 模块,并通过 修改配置 来使用现有的基础设施。
架构总览
Infra 模块默认包含以下组件,使用以下默认端口与域名:
| 组件 | 端口 | 默认域名 | 描述 |
|---|---|---|---|
| Nginx | 80/443 |
h.pigsty |
Web服务门户(本地软件仓库) |
| Grafana | 3000 |
g.pigsty |
可视化平台 |
| Prometheus | 9090 |
p.pigsty |
时间序列数据库(收存监控指标) |
| AlertManager | 9093 |
a.pigsty |
告警聚合分发 |
| Loki | 3100 |
- | 日志收集服务器 |
| PushGateway | 9091 |
- | 接受一次性的任务指标 |
| BlackboxExporter | 9115 |
- | 黑盒监控探测 |
| DNSMasq | 53 |
- | DNS 服务器 |
| Chronyd | 123 |
- | NTP 时间服务器 |
在单机上完整安装 Pigsty 功能集,节点上的组件大致如下图所示:
在默认情况下,INFRA 模块的故障 通常 不会影响现有 PostgreSQL 数据库集群的正常运行
在 Pigsty 中,PGSQL 模块会使用到 INFRA 模块上的一些服务,具体来说包括:
-
数据库集群/主机节点的域名,依赖INFRA节点的 DNSMASQ 解析。
- Pigsty 本身不使用这些域名,而使用 IP 地址直连,避免依赖 DNS。
-
在数据库节点软件上安装,需要用到 INFRA 模块提供的 Nginx 本地 yum/apt 软件仓库。
- 用户可以直接指定
repo_upstream与node_repo_modules,直接从互联网上游/其他本地仓库下载/安装软件
- 用户可以直接指定
-
数据库集群/节点的监控指标,会被INFRA节点的 Prometheus 收集抓取。
- 当
prometheus_enabled为false,不会收集监控指标。
- 当
-
数据库节点的日志会被 Promtail 收集,并发往 INFRA节点 上的 Loki(只会发往
infra_portal定义的端点)。- 如果
loki_enabled为false,则不会收集日志。
- 如果
-
数据库节点默认会从 INFRA/ADMIN节点 上的 NTP/Chronyd 服务器同步时间
- 如果是 Infra 节点,会默认配置使用公共 NTP 服务器,
- 其他节点会使用 INFRA/ADMIN 节点上的 NTP/Chronyd 服务器同步时间
- 如果您有专用 NTP 服务器,可以配置
node_ntp_servers使用
-
如果没有专用集群,高可用组件 Patroni 会使用 INFRA 节点上的 etcd 作为高可用DCS。
-
如果没有专用集群,备份组件 pgbackrest 会使用 INFRA 节点上的 minio 作为可选的集中备份仓库。
-
用户会从 Infra/Admin 节点上使用 Ansible 或其他工具发起对数据库节点的 管理:
- 执行集群创建,扩缩容,实例/集群回收
- 创建业务用户、业务数据库、修改服务、HBA修改;
- 执行日志采集、垃圾清理,备份,巡检等
Nginx
Nginx 是 Pigsty 所有 WebUI 类服务的访问入口,默认使用 80 / 443 端口对外提供 HTTP / HTTPS 服务。
带有 WebUI 的基础设施组件可以通过 Nginx 统一对外暴露服务,例如 Grafana,Prometheus,AlertManager,以及 HAProxy 控制台,此外,本地 yum/apt 仓库等静态文件资源也通过 Nginx 对内提供服务。
Nginx 会根据 infra_portal 的定义配置本地 Web 服务器或反向代理服务器,例如默认配置为:
infra_portal:
  home         : { domain: h.pigsty }
  grafana      : { domain: g.pigsty ,endpoint: "${admin_ip}:3000" ,websocket: true }
  prometheus   : { domain: p.pigsty ,endpoint: "${admin_ip}:9090" }
  alertmanager : { domain: a.pigsty ,endpoint: "${admin_ip}:9093" }
  blackbox     : { endpoint: "${admin_ip}:9115" }
  loki         : { endpoint: "${admin_ip}:3100" }
  #minio        : { domain: sss.pigsty  ,endpoint: "${admin_ip}:9001" ,scheme: https ,websocket: true }
在这里默认记录的 endpoint 会被环境中的其他服务引用,例如,日志会发往 loki 对应的 endpoint 地址,而 Grafana 数据源会注册到 grafana 对应的 endpoint 地址,告警会发送至 alertmanager 对应的 endpoint 地址。
Pigsty 允许对 Nginx 进行丰富的定制,将其作为本地文件服务器,或者反向代理服务器,配置自签名或者真正的 HTTPS 证书。
Pigsty Demo 站点的样例 Nginx 配置
infra_portal:                     # domain names and upstream servers
  home         : { domain: home.pigsty.cc                                                 ,certbot: pigsty.demo }
  grafana      : { domain: demo.pigsty.cc ,endpoint: "${admin_ip}:3000", websocket: true  ,certbot: pigsty.demo }
  prometheus   : { domain: p.pigsty.cc    ,endpoint: "${admin_ip}:9090"                   ,certbot: pigsty.demo }
  alertmanager : { domain: a.pigsty.cc    ,endpoint: "${admin_ip}:9093"                   ,certbot: pigsty.demo }
  blackbox     : { endpoint: "${admin_ip}:9115"                                                               }
  loki         : { endpoint: "${admin_ip}:3100"                                                               }
  postgrest    : { domain: api.pigsty.cc  ,endpoint: "127.0.0.1:8884"                                         }
  pgadmin      : { domain: adm.pigsty.cc  ,endpoint: "127.0.0.1:8885"                                         }
  pgweb        : { domain: cli.pigsty.cc  ,endpoint: "127.0.0.1:8886"                                         }
  bytebase     : { domain: ddl.pigsty.cc  ,endpoint: "127.0.0.1:8887"                                         }
  jupyter      : { domain: lab.pigsty.cc  ,endpoint: "127.0.0.1:8888"   ,websocket: true                      }
  gitea        : { domain: git.pigsty.cc  ,endpoint: "127.0.0.1:8889"                     ,certbot: pigsty.cc }
  wiki         : { domain: wiki.pigsty.cc ,endpoint: "127.0.0.1:9002"                     ,certbot: pigsty.cc }
  noco         : { domain: noco.pigsty.cc ,endpoint: "127.0.0.1:9003"                     ,certbot: pigsty.cc }
  supa         : { domain: supa.pigsty.cc ,endpoint: "10.2.82.163:8000" ,websocket: true  ,certbot: pigsty.cc }
  dify         : { domain: dify.pigsty.cc ,endpoint: "10.2.82.163:8001" ,websocket: true  ,certbot: pigsty.cc }
  odoo         : { domain: odoo.pigsty.cc ,endpoint: "127.0.0.1:8069"   ,websocket: true  ,certbot: pigsty.cc }
  mm           : { domain: mm.pigsty.cc   ,endpoint: "10.2.82.163:8065" ,websocket: true                      }
  web.io:
    domain: en.pigsty.cc
    path: "/www/web.io"
    certbot: pigsty.doc
    enforce_https: true
    config: |
      # rewrite /zh/ to /
          location /zh/ {
              rewrite ^/zh/(.*)$ /$1 permanent;
          }
  web.cc:
    domain: pigsty.cc
    path: "/www/web.cc"
    domains: [ zh.pigsty.cc ]
    certbot: pigsty.doc
    config: |
      # rewrite /zh/ to /
          location /zh/ {
              rewrite ^/zh/(.*)$ /$1 permanent;
          }
  repo:
    domain: pro.pigsty.cc
    path: "/www/repo"
    index: true
    certbot: pigsty.doc
更多信息,请参考以下教程:
本地软件仓库
Pigsty 会在安装时,默认在 Infra 节点是那个创建一个本地软件仓库,以加速后续软件安装。
该软件仓库默认位位于 /www/pigsty 目录,由 Nginx 提供服务,可以访问 http://h.pigsty/pigsty 使用。
Pigsty的 离线软件包 是将已经建立好的软件源目录整个打成压缩包:当Pigsty尝试构建本地源时,如果发现本地源目录 /www/pigsty 已经存在,且带有 /www/pigsty/repo_complete 标记文件,则会认为本地源已经构建完成,从而跳过从原始上游下载软件的步骤,消除了对互联网访问的依赖。
Repo定义文件位于 /www/pigsty.repo,默认可以通过 http://${admin_ip}/pigsty.repo 获取
curl -L http://h.pigsty/pigsty.repo -o /etc/yum.repos.d/pigsty.repo
您也可以在没有Nginx的情况下直接使用文件本地源:
[pigsty-local]
name=Pigsty local $releasever - $basearch
baseurl=file:///www/pigsty/
enabled=1
gpgcheck=0
本地软件仓库相关配置参数位于:配置:INFRA - REPO
Prometheus
Prometheus是监控时序数据库,默认监听9090端口,可以直接通过IP:9090或域名http://p.pigsty访问。
Prometheus是监控用时序数据库,提供以下功能:
- Prometheus默认通过本地静态文件服务发现获取监控对象,并为其关联身份信息。
- Prometheus从Exporter拉取监控指标数据,进行预计算加工后存入自己的TSDB中。
- Prometheus计算报警规则,将报警事件发往Alertmanager处理。
AlertManager是与Prometheus配套的告警平台,默认监听9093端口,可以直接通过IP:9093或域名 http://a.pigsty 访问。
Prometheus的告警事件会发送至AlertManager,但如果需要进一步处理,用户需要进一步对其进行配置,例如提供SMTP服务配置以发送告警邮件。
Prometheus、AlertManager,PushGateway,BlackboxExporter 的相关配置参数位于:配置:INFRA - PROMETHEUS
Grafana
Grafana是开源的可视化/监控平台,是Pigsty WebUI的核心,默认监听3000端口,可以直接通过IP:3000或域名http://g.pigsty访问。
Pigsty的监控系统基于Dashboard构建,通过URL进行连接与跳转。您可以快速地在监控中下钻上卷,快速定位故障与问题。
此外,Grafana还可以用作通用的低代码前后端平台,制作交互式可视化数据应用。因此,Pigsty使用的Grafana带有一些额外的可视化插件,例如ECharts面板。
Loki是用于日志收集的日志数据库,默认监听3100端口,节点上的Promtail向元节点上的Loki推送日志。
Grafana与Loki相关配置参数位于:配置:INFRA - GRAFANA,配置:INFRA - Loki
Ansible
Pigsty默认会在元节点上安装Ansible,Ansible是一个流行的运维工具,采用声明式的配置风格与幂等的剧本设计,可以极大降低系统维护的复杂度。
DNSMASQ
DNSMASQ 提供环境内的DNS解析服务,其他模块的域名将会注册到 INFRA节点上的 DNSMASQ 服务中。
DNS记录默认放置于所有INFRA节点的 /etc/hosts.d/ 目录中。
DNSMASQ相关配置参数位于:配置:INFRA - DNS
Chronyd
NTP服务用于同步环境内所有节点的时间(可选)
NTP相关配置参数位于:配置:NODES - NTP
2 - 集群配置
配置说明
INFRA 主要用于提供 监控 基础设施,对于 PostgreSQL 数据库是 可选项 。
除非您在某些地方手工配置了对 INFRA 节点上 DNS / NTP 服务的依赖,否则 INFRA 模块的故障通常不会影响 PostgreSQL 数据库集群的正常运行。
在大多数情况下,单个 INFRA 节点足以应对绝大部分场景的需求。对于有一定要求的生产环境,建议使用 2~3 个 INFRA 节点以实现高可用。
通常出于提高资源利用率的考虑,PostgreSQL 高可用依赖的 ETCD 模块可以与 INFRA 模块共用节点。
使用 3 个以上的 INFRA 节点没有太大意义,但您可以使用更多的 ETCD 节点(例如 5 个)来提高 DCS 服务的可用性与可靠性。
配置样例
要在节点上安装 INFRA 模块,首先需要在 配置清单 中的 infra 分组加入节点 IP,并为其分配 Infra 实例号 infra_seq。
默认情况下,配置单个 INFRA 节点便足以满足大部分场景下的需求,所有配置模板都默认带有 infra 分组的定义:
all:
  children:
    infra: { hosts: { 10.10.10.10: { infra_seq: 1 } }}
默认情况下,infra 分组中的 10.10.10.10 IP 占位符会在 配置 过程中被替换为 当前节点首要IP地址。
也就是会在当前节点上安装 INFRA 模块。
然后,使用 infra.yml 剧本在节点上初始化 INFRA 模块即可。
更多节点
配置两个 INFRA 节点,可以将新节点 IP 加入 infra.hosts
all:
  children:

    infra:
      hosts:
        10.10.10.10: { infra_seq: 1 }
        10.10.10.11: { infra_seq: 2 }
配置三个 INFRA 节点,并配置一些 Infra 集群/节点的参数:
all:
  children:

    infra:
      hosts:
        10.10.10.10: { infra_seq: 1 }
        10.10.10.11: { infra_seq: 2, repo_enabled: false }
        10.10.10.12: { infra_seq: 3, repo_enabled: false }
      vars:
        grafana_clean: false
        prometheus_clean: false
        loki_clean: false
Infra 高可用
Infra 模块中的大部分组件都属于 “无状态/相同状态” ,对于这类组件,高可用只需要操心 “负载均衡” 问题。
Infra 组件负载均衡可以通过两种方式实现: Keepalived L2 VIP,或 HAProxy 四层负载均衡。
如果您的网络环境二层互通,则可以使用 Keepalived L2 VIP 实现高可用。
infra:
  hosts:
    10.10.10.10: { infra_seq: 1 }
    10.10.10.11: { infra_seq: 2 }
    10.10.10.12: { infra_seq: 3 }
  vars:
    vip_enabled: true
    vip_vrid: 128
    vip_address: 10.10.10.8
    vip_interface: eth1

    infra_portal:
      home         : { domain: h.pigsty }
      grafana      : { domain: g.pigsty ,endpoint: "10.10.10.8:3000" , websocket: true }
      prometheus   : { domain: p.pigsty ,endpoint: "10.10.10.8:9090" }
      alertmanager : { domain: a.pigsty ,endpoint: "10.10.10.8:9093" }
      blackbox     : { endpoint: "10.10.10.8:9115" }
      loki         : { endpoint: "10.10.10.8:3100" }
除了设置 vip_address 等 VIP 相关参数外,您还需要在 infra_portal 中修改各项 Infra 服务的端点。
Nginx配置
本地仓库配置
DNS配置
NTP配置
3 - 参数列表
INFRA 模块有下列 10 个参数组,共计 60 个关于基础设施组件的参数:
META:Pigsty 元数据,版本号,管理节点CA:自签名公私钥基础设施/CAINFRA_ID:基础设施门户,Nginx/域名配置REPO:本地软件仓库:YUM/APTINFRA_PACKAGE:基础设施软件包NGINX:Nginx 网络服务器与 Certbot 证书DNS:DNSMASQ 域名服务器PROMETHEUS:Prometheus 时序数据库全家桶GRAFANA:Grafana 可观测性全家桶LOKI:Loki 日志服务
| 参数 | 参数组 | 类型 | 层次 | 中文说明 |
|---|---|---|---|---|
version |
META |
string |
G | pigsty 版本字符串 |
admin_ip |
META |
ip |
G | 管理节点 IP 地址 |
region |
META |
enum |
G | 上游镜像区域:default,china,europe |
proxy_env |
META |
dict |
G | 下载包时使用的全局代理环境变量 |
ca_method |
CA |
enum |
G | CA处理方式:create,recreate,copy,默认为没有则创建 |
ca_cn |
CA |
string |
G | CA CN名称,固定为 pigsty-ca |
cert_validity |
CA |
interval |
G | 证书有效期,默认为 20 年 |
infra_seq |
INFRA_ID |
int |
I | 基础设施节号,必选身份参数 |
infra_portal |
INFRA_ID |
dict |
G | 通过Nginx门户暴露的基础设施服务列表 |
repo_enabled |
REPO |
bool |
G/I | 在此基础设施节点上创建软件仓库? |
repo_home |
REPO |
path |
G | 软件仓库主目录,默认为/www |
repo_name |
REPO |
string |
G | 软件仓库名称,默认为 pigsty |
repo_endpoint |
REPO |
url |
G | 仓库的访问点:域名或 ip:port 格式 |
repo_remove |
REPO |
bool |
G/A | 构建本地仓库时是否移除现有上游仓库源定义文件? |
repo_modules |
REPO |
string |
G/A | 启用的上游仓库模块列表,用逗号分隔 |
repo_upstream |
REPO |
upstream[] |
G | 上游仓库源定义:从哪里下载上游包? |
repo_packages |
REPO |
string[] |
G | 从上游仓库下载哪些软件包? |
repo_extra_packages |
REPO |
string[] |
G/C/I | 从上游仓库下载哪些额外的软件包? |
repo_url_packages |
REPO |
string[] |
G | 使用URL下载的额外软件包列表 |
infra_packages |
INFRA_PACKAGE |
string[] |
G | 在基础设施节点上要安装的软件包 |
infra_packages_pip |
INFRA_PACKAGE |
string |
G | 在基础设施节点上使用 pip 安装的包 |
nginx_enabled |
NGINX |
bool |
G/I | 在此基础设施节点上启用 nginx? |
nginx_exporter_enabled |
NGINX |
bool |
G/I | 在此基础设施节点上启用 nginx_exporter? |
nginx_sslmode |
NGINX |
enum |
G | nginx SSL模式?disable,enable,enforce |
nginx_home |
NGINX |
path |
G | nginx 内容目录,默认为 /www,通常和仓库目录一致 |
nginx_port |
NGINX |
port |
G | nginx 监听端口,默认为 80 |
nginx_ssl_port |
NGINX |
port |
G | nginx SSL监听端口,默认为 443 |
nginx_navbar |
NGINX |
index[] |
G | nginx 首页导航链接列表 |
certbot_sign |
NGINX |
bool |
G/A | 是否使用 certbot 自动申请证书?默认为 false |
certbot_email |
NGINX |
string |
G/A | 申请证书时使用的 email,用于接受过期提醒邮件 |
certbot_option |
NGINX |
string |
G/A | 申请证书时额外传入的的配置参数 |
dns_enabled |
DNS |
bool |
G/I | 在此基础设施节点上设置dnsmasq? |
dns_port |
DNS |
port |
G | DNS 服务器监听端口,默认为 53 |
dns_records |
DNS |
string[] |
G | 由 dnsmasq 解析的动态 DNS 记录 |
prometheus_enabled |
PROMETHEUS |
bool |
G/I | 在此基础设施节点上启用 prometheus? |
prometheus_clean |
PROMETHEUS |
bool |
G/A | 初始化Prometheus的时候清除现有数据? |
prometheus_data |
PROMETHEUS |
path |
G | Prometheus 数据目录,默认为 /data/prometheus |
prometheus_sd_dir |
PROMETHEUS |
path |
G | Prometheus 服务发现目标文件目录 |
prometheus_sd_interval |
PROMETHEUS |
interval |
G | Prometheus 目标刷新间隔,默认为 5s |
prometheus_scrape_interval |
PROMETHEUS |
interval |
G | Prometheus 抓取 & 评估间隔,默认为 10s |
prometheus_scrape_timeout |
PROMETHEUS |
interval |
G | Prometheus 全局抓取超时,默认为 8s |
prometheus_options |
PROMETHEUS |
arg |
G | Prometheus 额外的命令行参数选项 |
pushgateway_enabled |
PROMETHEUS |
bool |
G/I | 在此基础设施节点上设置 pushgateway? |
pushgateway_options |
PROMETHEUS |
arg |
G | pushgateway 额外的命令行参数选项 |
blackbox_enabled |
PROMETHEUS |
bool |
G/I | 在此基础设施节点上设置 blackbox_exporter? |
blackbox_options |
PROMETHEUS |
arg |
G | blackbox_exporter 额外的命令行参数选项 |
alertmanager_enabled |
PROMETHEUS |
bool |
G/I | 在此基础设施节点上设置 alertmanager? |
alertmanager_port |
PROMETHEUS |
arg |
G | alertmanager 监听端口号,默认为 9093 |
alertmanager_options |
PROMETHEUS |
arg |
G | alertmanager 额外的命令行参数选项 |
exporter_metrics_path |
PROMETHEUS |
path |
G | exporter 指标路径,默认为 /metrics |
exporter_install |
PROMETHEUS |
enum |
G | 如何安装 exporter?none,yum,binary |
exporter_repo_url |
PROMETHEUS |
url |
G | 通过 yum 安装exporter时使用的yum仓库文件地址 |
grafana_enabled |
GRAFANA |
bool |
G/I | 在此基础设施节点上启用 Grafana? |
grafana_clean |
GRAFANA |
bool |
G/A | 初始化Grafana期间清除数据? |
grafana_admin_username |
GRAFANA |
username |
G | Grafana 管理员用户名,默认为 admin |
grafana_admin_password |
GRAFANA |
password |
G | Grafana 管理员密码,默认为 pigsty |
loki_enabled |
LOKI |
bool |
G/I | 在此基础设施节点上启用 loki? |
loki_clean |
LOKI |
bool |
G/A | 是否删除现有的 loki 数据? |
loki_data |
LOKI |
path |
G | loki 数据目录,默认为 /data/loki |
loki_retention |
LOKI |
interval |
G | loki 日志保留期,默认为 15d |
META
这一小节指定了一套 Pigsty 部署的元数据:包括版本号,管理员节点 IP 地址,软件源镜像上游区域 和下载软件包时使用的 http(s) 代理。
version: v3.4.0                   # pigsty 版本号
admin_ip: 10.10.10.10             # 管理节点IP地址
region: default                   # 上游镜像区域:default,china,europe
proxy_env:                        # 全局HTTPS代理,用于下载、安装软件包。
  no_proxy: "localhost,127.0.0.1,10.0.0.0/8,192.168.0.0/16,*.pigsty,*.aliyun.com,mirrors.*,*.myqcloud.com,*.tsinghua.edu.cn"
  # http_proxy:  # set your proxy here: e.g http://user:pass@proxy.xxx.com
  # https_proxy: # set your proxy here: e.g http://user:pass@proxy.xxx.com
  # all_proxy:   # set your proxy here: e.g http://user:pass@proxy.xxx.com
version
参数名称: version, 类型: string, 层次:G
Pigsty 版本号字符串,默认值为当前版本:v3.3.0。
Pigsty 内部会使用版本号进行功能控制与内容渲染。
Pigsty使用语义化版本号,版本号字符串通常以字符 v 开头。
admin_ip
参数名称: admin_ip, 类型: ip, 层次:G
管理节点的 IP 地址,默认为占位符 IP 地址:10.10.10.10
由该参数指定的节点将被视为管理节点,通常指向安装 Pigsty 时的第一个节点,即中控节点。
默认值 10.10.10.10 是一个占位符,会在 configure 过程中被替换为实际的管理节点 IP 地址。
许多参数都会引用此参数,例如:
在这些参数中,字符串 ${admin_ip} 会被替换为 admin_ip 的真实取值。使用这种机制,您可以为不同的节点指定不同的中控管理节点。
region
参数名称: region, 类型: enum, 层次:G
上游镜像的区域,默认可选值为:upstream mirror region: default,china,europe,默认为: default
如果一个不同于 default 的区域被设置,且在 repo_upstream 中有对应的条目,将会使用该条目对应 baseurl 代替 default 中的 baseurl。
例如,如果您的区域被设置为 china,那么 Pigsty 会尝试使用中国地区的上游软件镜像站点以加速下载,如果某个上游软件仓库没有对应的中国地区镜像,那么会使用默认的上游镜像站点替代。
同时,在 repo_url_packages 中定义的 URL 地址,也会进行从 repo.pigsty.io 到 repo.pigsty.cc 的替换,以使用国内的镜像源。
proxy_env
参数名称: proxy_env, 类型: dict, 层次:G
下载包时使用的全局代理环境变量,默认值指定了 no_proxy,即不使用代理的地址列表:
proxy_env:
  no_proxy: "localhost,127.0.0.1,10.0.0.0/8,192.168.0.0/16,*.pigsty,*.aliyun.com,mirrors.aliyuncs.com,mirrors.tuna.tsinghua.edu.cn,mirrors.zju.edu.cn"
  #http_proxy: 'http://username:password@proxy.address.com'
  #https_proxy: 'http://username:password@proxy.address.com'
  #all_proxy: 'http://username:password@proxy.address.com'
当您在中国大陆地区从互联网上游安装时,特定的软件包可能会被墙,您可以使用代理来解决这个问题。
请注意,如果使用了 Docker 模块,那么这里的代理服务器配置也会写入 Docker Daemon 配置文件中。
请注意,如果在 ./configure 过程中指定了 -x 参数,那么当前环境中的代理配置信息将会被自动填入到生成的 pigsty.yaml 文件中。
CA
Pigsty 使用的自签名 CA 证书,用于支持高级安全特性。
ca_method: create                 # CA处理方式:create,recreate,copy,默认为没有则创建
ca_cn: pigsty-ca                  # CA CN名称,固定为 pigsty-ca
cert_validity: 7300d              # 证书有效期,默认为 20 年
ca_method
参数名称: ca_method, 类型: enum, 层次:G
CA处理方式:create , recreate ,copy,默认为没有则创建
默认值为: create,即如果不存在则创建一个新的 CA 证书。
create:如果files/pki/ca中不存在现有的CA,则创建一个全新的 CA 公私钥对,否则就直接使用现有的 CA 公私钥对。recreate:总是创建一个新的 CA 公私钥对,覆盖现有的 CA 公私钥对。注意,这是一个危险的操作。copy:假设files/pki/ca目录下已经有了一对CA公私钥对,并将ca_method设置为copy,Pigsty 将会使用现有的 CA 公私钥对。如果不存在则会报错
如果您已经有了一对 CA 公私钥对,可以将其复制到 files/pki/ca 目录下,并将 ca_method 设置为 copy,Pigsty 将会使用现有的 CA 公私钥对,而不是新建一个。
请注意,务必保留并备份好一套部署新生成的 CA 私钥文件。
ca_cn
参数名称: ca_cn, 类型: string, 层次:G
CA CN名称,固定为 pigsty-ca,不建议修改。
你可以使用以下命令来查看节点上的 Pigsty CA 证书: openssl x509 -text -in /etc/pki/ca.crt
cert_validity
参数名称: cert_validity, 类型: interval, 层次:G
签发证书的有效期,默认为 20 年,对绝大多数场景都足够了。默认值为: 7300d
INFRA_ID
Infrastructure identity and portal definition.
#infra_seq: 1                     # infra node identity, explicitly required
infra_portal:                     # infra services exposed via portal
  home         : { domain: h.pigsty }
  grafana      : { domain: g.pigsty ,endpoint: "${admin_ip}:3000" ,websocket: true }
  prometheus   : { domain: p.pigsty ,endpoint: "${admin_ip}:9090" }
  alertmanager : { domain: a.pigsty ,endpoint: "${admin_ip}:9093" }
  blackbox     : { endpoint: "${admin_ip}:9115" }
  loki         : { endpoint: "${admin_ip}:3100" }
infra_seq
参数名称: infra_seq, 类型: int, 层次:I
基础设施节号,必选身份参数,所以不提供默认值,必须在基础设施节点上显式指定。
infra_portal
参数名称: infra_portal, 类型: dict, 层次:G
通过Nginx门户暴露的基础设施服务列表,默认情况下,Pigsty 会通过 Nginx 对外暴露以下服务:
infra_portal:
  home         : { domain: h.pigsty }
  grafana      : { domain: g.pigsty ,endpoint: "${admin_ip}:3000" ,websocket: true }
  prometheus   : { domain: p.pigsty ,endpoint: "${admin_ip}:9090" }
  alertmanager : { domain: a.pigsty ,endpoint: "${admin_ip}:9093" }
  blackbox     : { endpoint: "${admin_ip}:9115" }
  loki         : { endpoint: "${admin_ip}:3100" }
每条记录由一个 Key 与一个 Value 字典组成,name 作为键,代表组件名称,值为对象,可以配置以下参数:
name: 必选项,指定 Nginx 服务器的名称- 默认记录:
home,grafana,prometheus,alertmanager,blackbox,loki为固定名称,请勿修改。 - 用作 Nginx 配置文件名称的一部分,对应配置文件为:
/etc/nginx/conf.d/<name>.conf - 没有配置
domain字段的 Nginx Server 不会生成配置文件,仅作为参考引用之用。
- 默认记录:
domain: 可选,当服务需要通过 Nginx 对外暴露时,为必选项,指定使用的域名- 在 Pigsty 自签名 Nginx HTTPS 证书中,域名将被添加到Nginx SSL证书的
SAN字段中 - Pigsty web 页面之间的交叉引用会使用这里的默认域名
- 在 Pigsty 自签名 Nginx HTTPS 证书中,域名将被添加到Nginx SSL证书的
endpoint:通常与path二选一,指定上游服务器地址,设置endpoint表示这是一个反向代理服务器- 在配置中可以使用
${admin_ip}作为占位符,部署时将动态替换为admin_ip - 反向代理服务器默认使用
endpoint.conf作为配置模板 - 反向代理服务器还可以配置
websocket与schema参数
- 在配置中可以使用
path: 通常与endpoint二选一,指定本地文件服务器路径,设置path表示这是一个本地Web服务器- 本地Web服务器默认使用
path.conf作为配置模板 - 本地Web服务器还可以配置
index参数,是否启用文件索引页
- 本地Web服务器默认使用
certbot:Certbot 证书名称,如果配置,会使用 Certbot 申请证书- 如果有多个服务器指定了相同的
certbot,Pigsty 会进行合并申请,最终证书名称为这个certbot的名称
- 如果有多个服务器指定了相同的
cert:Nginx 证书文件路径,如果配置,会覆盖默认的证书路径key:Nginx 证书密钥文件路径,如果配置,会覆盖默认的证书密钥路径websocket:是否启用 WebSocket 支持- 只有反向代理服务器可以配置此参数,如果开启将允许上游使用 WebSocket 连接
schema:上游服务器使用的协议,如果配置,会覆盖默认的协议- 默认为
http,如果配置https则强制使用 HTTPS 连接上游服务器
- 默认为
index:是否启用文件索引页- 只有本地Web服务器可以配置此参数,如果开启将开启
autoindex配置,自动为目录生成索引页
- 只有本地Web服务器可以配置此参数,如果开启将开启
log:Nginx 日志文件路径- 如果指定,访问日志将写入此文件,否则根据服务器类型使用默认的日志文件
- 反向代理服务器,默认使用
/var/log/nginx/<name>.log作为日志文件路径 - 本地Web服务器,使用默认的 Access 日志
conf:Nginx 配置文件路径- 显示指定使用的配置模板文件,位于
roles/infra/templates/nginx或templates/nginx目录 - 未指定本参数时,会使用默认的配置模板,位于
roles/infra/templates/nginx或templates/nginx目录
- 显示指定使用的配置模板文件,位于
config:Nginx 配置代码块- 直接注入到 Nginx Server 配置块中的配置文本
enforce_https:将 HTTP 服务器重定向到 HTTPS 服务器- 全局配置可以通过
nginx_sslmode: enforce来指定 - 此配置不影响默认的
home服务器,home服务器会始终同时监听 80 与 443 端口确保兼容性。
- 全局配置可以通过
REPO
本节配置是关于本地软件仓库的。 Pigsty 默认会在基础设施节点上启用一个本地软件仓库(APT / YUM)。
在初始化过程中,Pigsty 会从互联网上游仓库(由 repo_upstream 指定)下载所有软件包及其依赖项(由 repo_packages 指定)
到 {{ nginx_home }} / {{ repo_name }} (默认为 /www/pigsty),所有软件及其依赖的总大小约为1GB左右。
创建本地软件仓库时,如果仓库已存在(判断方式:仓库目录目录中有一个名为 repo_complete 的标记文件)Pigsty 将认为仓库已经创建完成,跳过软件下载阶段,直接使用构建好的仓库。
如果某些软件包的下载速度太慢,您可以通过使用 proxy_env 配置项来设置下载代理来完成首次下载,或直接下载预打包的 离线软件包,离线软件包本质上就是在同样操作系统上构建好的本地软件源。
repo_enabled: true                # 在当前基础设施节点上启用本地软件仓库?
repo_home: /www                   # 仓库主目录,默认为 `/www`
repo_name: pigsty                 # 仓库名称,默认为 pigsty
repo_endpoint: http://${admin_ip}:80 # 访问此仓库的端点,可以是域名或IP:端口
repo_remove: true                 # 移除现有的上游仓库
repo_modules: infra,node,pgsql    # 在仓库引导过程中安装上游仓库
#repo_upstream: []                # 从哪里下载软件包
#repo_packages: []                # 下载哪些软件包
#repo_extra_packages: []          # 额外下载的软件包
repo_url_packages: []             # 从URL下载的额外软件包
repo_enabled
参数名称: repo_enabled, 类型: bool, 层次:G/I
是否在当前的基础设施节点上启用本地软件源?默认为: true,即所有 Infra 节点都会设置一个本地软件仓库。
如果您有多个基础设施节点,可以只保留 1 ~ 2 个节点作为软件仓库,其他节点可以通过设置此参数为 false 来避免重复软件下载构建。
repo_home
参数名称: repo_home, 类型: path, 层次:G
本地软件仓库的家目录,默认为 Nginx 的根目录,也就是: /www,我们不建议您修改此目录。如果修改,需要和 nginx_home
repo_name
参数名称: repo_name, 类型: string, 层次:G
本地仓库名称,默认为 pigsty,更改此仓库的名称是不明智的行为。
repo_endpoint
参数名称: repo_endpoint, 类型: url, 层次:G
其他节点访问此仓库时使用的端点,默认值为:http://${admin_ip}:80。
Pigsty 默认会在基础设施节点 80/443 端口启动 Nginx,对外提供本地软件源(静态文件)服务。
如果您修改了 nginx_port 与 nginx_ssl_port,或者使用了不同于中控节点的基础设施节点,请相应调整此参数。
如果您使用了域名,可以在 node_default_etc_hosts、node_etc_hosts、或者 dns_records 中添加解析。
repo_remove
参数名称: repo_remove, 类型: bool, 层次:G/A
在构建本地软件源时,是否移除现有的上游仓库定义?默认值: true。
当启用此参数时,/etc/yum.repos.d 中所有已有仓库文件会被移动备份至/etc/yum.repos.d/backup,在 Debian 系上是移除 /etc/apt/sources.list 和 /etc/apt/sources.list.d,将文件备份至 /etc/apt/backup 中。
因为操作系统已有的源内容不可控,使用 Pigsty 验证过的上游软件源可以提高从互联网下载软件包的成功率与速度。
但在一些特定情况下(例如您的操作系统是某种 EL/Deb 兼容版,许多软件包使用了自己的私有源),您可能需要保留现有的上游仓库定义,此时可以将此参数设置为 false。
repo_modules
参数名称: repo_modules, 类型: string, 层次:G/A
哪些上游仓库模块会被添加到本地软件源中,默认值: infra,node,pgsql
当 Pigsty 尝试添加上游仓库时,会根据此参数的值来过滤 repo_upstream 中的条目,只有 module 字段与此参数值匹配的条目才会被添加到本地软件源中。
模块以逗号分隔,可用的模块列表请参考 repo_upstream 中的定义
repo_upstream
参数名称: repo_upstream, 类型: upstream[], 层次:G
构建本地软件源时,从哪里下载上游软件包?本参数没有默认值,如果用户不在配置文件中显式指定,则会从根据当前节点的操作系统族,从定义于 roles/node_id/vars 中的 repo_upstream_default 变量中加载获取。
对于 EL (7,8,9)系统,默认使用的软件源如下所示:
- { name: pigsty-local   ,description: 'Pigsty Local'       ,module: local   ,releases: [7,8,9] ,arch: [x86_64, aarch64] ,baseurl: { default: 'http://${admin_ip}/pigsty'  }} # used by intranet nodes
- { name: pigsty-infra   ,description: 'Pigsty INFRA'       ,module: infra   ,releases: [7,8,9] ,arch: [x86_64, aarch64] ,baseurl: { default: 'https://repo.pigsty.io/yum/infra/$basearch' ,china: 'https://repo.pigsty.cc/yum/infra/$basearch' }}
- { name: pigsty-pgsql   ,description: 'Pigsty PGSQL'       ,module: pgsql   ,releases: [7,8,9] ,arch: [x86_64, aarch64] ,baseurl: { default: 'https://repo.pigsty.io/yum/pgsql/el$releasever.$basearch' ,china: 'https://repo.pigsty.cc/yum/pgsql/el$releasever.$basearch' }}
- { name: nginx          ,description: 'Nginx Repo'         ,module: infra   ,releases: [7,8,9] ,arch: [x86_64, aarch64] ,baseurl: { default: 'https://nginx.org/packages/rhel/$releasever/$basearch/' }}
- { name: docker-ce      ,description: 'Docker CE'          ,module: infra   ,releases: [7,8,9] ,arch: [x86_64, aarch64] ,baseurl: { default: 'https://download.docker.com/linux/centos/$releasever/$basearch/stable'        ,china: 'https://mirrors.aliyun.com/docker-ce/linux/centos/$releasever/$basearch/stable' ,europe: 'https://mirrors.xtom.de/docker-ce/linux/centos/$releasever/$basearch/stable' }}
- { name: baseos         ,description: 'EL 8+ BaseOS'       ,module: node    ,releases: [  8,9] ,arch: [x86_64, aarch64] ,baseurl: { default: 'https://dl.rockylinux.org/pub/rocky/$releasever/BaseOS/$basearch/os/'         ,china: 'https://mirrors.aliyun.com/rockylinux/$releasever/BaseOS/$basearch/os/'         ,europe: 'https://mirrors.xtom.de/rocky/$releasever/BaseOS/$basearch/os/'     }}
- { name: appstream      ,description: 'EL 8+ AppStream'    ,module: node    ,releases: [  8,9] ,arch: [x86_64, aarch64] ,baseurl: { default: 'https://dl.rockylinux.org/pub/rocky/$releasever/AppStream/$basearch/os/'      ,china: 'https://mirrors.aliyun.com/rockylinux/$releasever/AppStream/$basearch/os/'      ,europe: 'https://mirrors.xtom.de/rocky/$releasever/AppStream/$basearch/os/'  }}
- { name: extras         ,description: 'EL 8+ Extras'       ,module: node    ,releases: [  8,9] ,arch: [x86_64, aarch64] ,baseurl: { default: 'https://dl.rockylinux.org/pub/rocky/$releasever/extras/$basearch/os/'         ,china: 'https://mirrors.aliyun.com/rockylinux/$releasever/extras/$basearch/os/'         ,europe: 'https://mirrors.xtom.de/rocky/$releasever/extras/$basearch/os/'     }}
- { name: powertools     ,description: 'EL 8 PowerTools'    ,module: node    ,releases: [  8  ] ,arch: [x86_64, aarch64] ,baseurl: { default: 'https://dl.rockylinux.org/pub/rocky/$releasever/PowerTools/$basearch/os/'     ,china: 'https://mirrors.aliyun.com/rockylinux/$releasever/PowerTools/$basearch/os/'     ,europe: 'https://mirrors.xtom.de/rocky/$releasever/PowerTools/$basearch/os/' }}
- { name: crb            ,description: 'EL 9 CRB'           ,module: node    ,releases: [    9] ,arch: [x86_64, aarch64] ,baseurl: { default: 'https://dl.rockylinux.org/pub/rocky/$releasever/CRB/$basearch/os/'            ,china: 'https://mirrors.aliyun.com/rockylinux/$releasever/CRB/$basearch/os/'            ,europe: 'https://mirrors.xtom.de/rocky/$releasever/CRB/$basearch/os/'        }}
- { name: epel           ,description: 'EL 8+ EPEL'         ,module: node    ,releases: [  8,9] ,arch: [x86_64, aarch64] ,baseurl: { default: 'http://download.fedoraproject.org/pub/epel/$releasever/Everything/$basearch/' ,china: 'https://mirrors.tuna.tsinghua.edu.cn/epel/$releasever/Everything/$basearch/'    ,europe: 'https://mirrors.xtom.de/epel/$releasever/Everything/$basearch/'     }}
- { name: pgdg-common    ,description: 'PostgreSQL Common'  ,module: pgsql   ,releases: [7,8,9] ,arch: [x86_64, aarch64] ,baseurl: { default: 'https://download.postgresql.org/pub/repos/yum/common/redhat/rhel-$releasever-$basearch' ,china: 'https://mirrors.tuna.tsinghua.edu.cn/postgresql/repos/yum/common/redhat/rhel-$releasever-$basearch' , europe: 'https://mirrors.xtom.de/postgresql/repos/yum/common/redhat/rhel-$releasever-$basearch' }}
- { name: pgdg-el8fix    ,description: 'PostgreSQL EL8FIX'  ,module: pgsql   ,releases: [  8  ] ,arch: [x86_64, aarch64] ,baseurl: { default: 'https://download.postgresql.org/pub/repos/yum/common/pgdg-centos8-sysupdates/redhat/rhel-8-x86_64/' ,china: 'https://mirrors.tuna.tsinghua.edu.cn/postgresql/repos/yum/common/pgdg-centos8-sysupdates/redhat/rhel-8-x86_64/' , europe: 'https://mirrors.xtom.de/postgresql/repos/yum/common/pgdg-centos8-sysupdates/redhat/rhel-8-x86_64/' } }
- { name: pgdg-el9fix    ,description: 'PostgreSQL EL9FIX'  ,module: pgsql   ,releases: [    9] ,arch: [x86_64, aarch64] ,baseurl: { default: 'https://download.postgresql.org/pub/repos/yum/common/pgdg-rocky9-sysupdates/redhat/rhel-9-x86_64/'  ,china: 'https://mirrors.tuna.tsinghua.edu.cn/postgresql/repos/yum/common/pgdg-rocky9-sysupdates/redhat/rhel-9-x86_64/' , europe: 'https://mirrors.xtom.de/postgresql/repos/yum/common/pgdg-rocky9-sysupdates/redhat/rhel-9-x86_64/' }}
- { name: pgdg13         ,description: 'PostgreSQL 13'      ,module: pgsql   ,releases: [7,8,9] ,arch: [x86_64, aarch64] ,baseurl: { default: 'https://download.postgresql.org/pub/repos/yum/13/redhat/rhel-$releasever-$basearch' ,china: 'https://mirrors.tuna.tsinghua.edu.cn/postgresql/repos/yum/13/redhat/rhel-$releasever-$basearch' ,europe: 'https://mirrors.xtom.de/postgresql/repos/yum/13/redhat/rhel-$releasever-$basearch' }}
- { name: pgdg14         ,description: 'PostgreSQL 14'      ,module: pgsql   ,releases: [7,8,9] ,arch: [x86_64, aarch64] ,baseurl: { default: 'https://download.postgresql.org/pub/repos/yum/14/redhat/rhel-$releasever-$basearch' ,china: 'https://mirrors.tuna.tsinghua.edu.cn/postgresql/repos/yum/14/redhat/rhel-$releasever-$basearch' ,europe: 'https://mirrors.xtom.de/postgresql/repos/yum/14/redhat/rhel-$releasever-$basearch' }}
- { name: pgdg15         ,description: 'PostgreSQL 15'      ,module: pgsql   ,releases: [7,8,9] ,arch: [x86_64, aarch64] ,baseurl: { default: 'https://download.postgresql.org/pub/repos/yum/15/redhat/rhel-$releasever-$basearch' ,china: 'https://mirrors.tuna.tsinghua.edu.cn/postgresql/repos/yum/15/redhat/rhel-$releasever-$basearch' ,europe: 'https://mirrors.xtom.de/postgresql/repos/yum/15/redhat/rhel-$releasever-$basearch' }}
- { name: pgdg16         ,description: 'PostgreSQL 16'      ,module: pgsql   ,releases: [  8,9] ,arch: [x86_64, aarch64] ,baseurl: { default: 'https://download.postgresql.org/pub/repos/yum/16/redhat/rhel-$releasever-$basearch' ,china: 'https://mirrors.tuna.tsinghua.edu.cn/postgresql/repos/yum/16/redhat/rhel-$releasever-$basearch' ,europe: 'https://mirrors.xtom.de/postgresql/repos/yum/16/redhat/rhel-$releasever-$basearch' }}
- { name: pgdg17         ,description: 'PostgreSQL 17'      ,module: pgsql   ,releases: [  8,9] ,arch: [x86_64, aarch64] ,baseurl: { default: 'https://download.postgresql.org/pub/repos/yum/17/redhat/rhel-$releasever-$basearch' ,china: 'https://mirrors.tuna.tsinghua.edu.cn/postgresql/repos/yum/17/redhat/rhel-$releasever-$basearch' ,europe: 'https://mirrors.xtom.de/postgresql/repos/yum/17/redhat/rhel-$releasever-$basearch' }}
- { name: pgdg-extras    ,description: 'PostgreSQL Extra'   ,module: extra   ,releases: [7,8,9] ,arch: [x86_64, aarch64] ,baseurl: { default: 'https://download.postgresql.org/pub/repos/yum/common/pgdg-rhel$releasever-extras/redhat/rhel-$releasever-$basearch' ,china: 'https://mirrors.tuna.tsinghua.edu.cn/postgresql/repos/yum/common/pgdg-rhel$releasever-extras/redhat/rhel-$releasever-$basearch' , europe: 'https://mirrors.xtom.de/postgresql/repos/yum/common/pgdg-rhel$releasever-extras/redhat/rhel-$releasever-$basearch' }}
- { name: pgdg13-nonfree ,description: 'PostgreSQL 13+'     ,module: extra   ,releases: [7,8,9] ,arch: [x86_64         ] ,baseurl: { default: 'https://download.postgresql.org/pub/repos/yum/non-free/13/redhat/rhel-$releasever-$basearch' ,china: 'https://mirrors.tuna.tsinghua.edu.cn/postgresql/repos/yum/non-free/13/redhat/rhel-$releasever-$basearch' ,europe: 'https://mirrors.xtom.de/postgresql/repos/yum/non-free/13/redhat/rhel-$releasever-$basearch' }}
- { name: pgdg14-nonfree ,description: 'PostgreSQL 14+'     ,module: extra   ,releases: [7,8,9] ,arch: [x86_64         ] ,baseurl: { default: 'https://download.postgresql.org/pub/repos/yum/non-free/14/redhat/rhel-$releasever-$basearch' ,china: 'https://mirrors.tuna.tsinghua.edu.cn/postgresql/repos/yum/non-free/14/redhat/rhel-$releasever-$basearch' ,europe: 'https://mirrors.xtom.de/postgresql/repos/yum/non-free/14/redhat/rhel-$releasever-$basearch' }}
- { name: pgdg15-nonfree ,description: 'PostgreSQL 15+'     ,module: extra   ,releases: [7,8,9] ,arch: [x86_64         ] ,baseurl: { default: 'https://download.postgresql.org/pub/repos/yum/non-free/15/redhat/rhel-$releasever-$basearch' ,china: 'https://mirrors.tuna.tsinghua.edu.cn/postgresql/repos/yum/non-free/15/redhat/rhel-$releasever-$basearch' ,europe: 'https://mirrors.xtom.de/postgresql/repos/yum/non-free/15/redhat/rhel-$releasever-$basearch' }}
- { name: pgdg16-nonfree ,description: 'PostgreSQL 16+'     ,module: extra   ,releases: [  8,9] ,arch: [x86_64         ] ,baseurl: { default: 'https://download.postgresql.org/pub/repos/yum/non-free/16/redhat/rhel-$releasever-$basearch' ,china: 'https://mirrors.tuna.tsinghua.edu.cn/postgresql/repos/yum/non-free/16/redhat/rhel-$releasever-$basearch' ,europe: 'https://mirrors.xtom.de/postgresql/repos/yum/non-free/16/redhat/rhel-$releasever-$basearch' }}
- { name: pgdg17-nonfree ,description: 'PostgreSQL 17+'     ,module: extra   ,releases: [  8,9] ,arch: [x86_64         ] ,baseurl: { default: 'https://download.postgresql.org/pub/repos/yum/non-free/17/redhat/rhel-$releasever-$basearch' ,china: 'https://mirrors.tuna.tsinghua.edu.cn/postgresql/repos/yum/non-free/17/redhat/rhel-$releasever-$basearch' ,europe: 'https://mirrors.xtom.de/postgresql/repos/yum/non-free/17/redhat/rhel-$releasever-$basearch' }}
- { name: timescaledb    ,description: 'TimescaleDB'        ,module: extra   ,releases: [7,8,9] ,arch: [x86_64, aarch64] ,baseurl: { default: 'https://packagecloud.io/timescale/timescaledb/el/$releasever/$basearch'  }}
- { name: wiltondb       ,description: 'WiltonDB'           ,module: mssql   ,releases: [7,8,9] ,arch: [x86_64, aarch64] ,baseurl: { default: 'https://repo.pigsty.io/yum/mssql/el$releasever.$basearch', china: 'https://repo.pigsty.cc/yum/mssql/el$releasever.$basearch' , origin: 'https://download.copr.fedorainfracloud.org/results/wiltondb/wiltondb/epel-$releasever-$basearch/' }}
- { name: ivorysql       ,description: 'IvorySQL'           ,module: ivory   ,releases: [7,8,9] ,arch: [x86_64         ] ,baseurl: { default: 'https://repo.pigsty.io/yum/ivory/el$releasever.$basearch', china: 'https://repo.pigsty.cc/yum/ivory/el$releasever.$basearch' }}
- { name: groonga        ,description: 'Groonga'            ,module: groonga ,releases: [  8,9] ,arch: [x86_64, aarch64] ,baseurl: { default: 'https://packages.groonga.org/almalinux/$releasever/$basearch/' }}
- { name: mysql          ,description: 'MySQL'              ,module: mysql   ,releases: [7,8,9] ,arch: [x86_64, aarch64] ,baseurl: { default: 'https://repo.mysql.com/yum/mysql-8.0-community/el/$releasever/$basearch/', china: 'https://mirrors.tuna.tsinghua.edu.cn/mysql/yum/mysql-8.0-community-el7-$basearch/'}}
- { name: mongo          ,description: 'MongoDB'            ,module: mongo   ,releases: [7,8,9] ,arch: [x86_64, aarch64] ,baseurl: { default: 'https://repo.mongodb.org/yum/redhat/$releasever/mongodb-org/8.0/$basearch/' , 'https://mirrors.aliyun.com/mongodb/yum/redhat/$releasever/mongodb-org/8.0/$basearch/' }}
- { name: redis          ,description: 'Redis'              ,module: redis   ,releases: [7    ] ,arch: [x86_64, aarch64] ,baseurl: { default: 'https://rpmfind.net/linux/remi/enterprise/$releasever/remi/$basearch/' }}
- { name: redis          ,description: 'Redis'              ,module: redis   ,releases: [  8,9] ,arch: [x86_64, aarch64] ,baseurl: { default: 'https://rpmfind.net/linux/remi/enterprise/$releasever/redis72/$basearch/' }}
- { name: grafana        ,description: 'Grafana'            ,module: grafana ,releases: [7,8,9] ,arch: [x86_64, aarch64] ,baseurl: { default: 'https://rpm.grafana.com' }}
- { name: kubernetes     ,description: 'Kubernetes'         ,module: kube    ,releases: [7,8,9] ,arch: [x86_64, aarch64] ,baseurl: { default: 'https://pkgs.k8s.io/core:/stable:/v1.31/rpm/', china: 'https://mirrors.aliyun.com/kubernetes-new/core/stable/v1.31/rpm/' }}
- { name: gitlab         ,description: 'Gitlab'             ,module: gitlab  ,releases: [  8,9] ,arch: [x86_64, aarch64] ,baseurl: { default: 'https://packages.gitlab.com/gitlab/gitlab-ee/el/$releasever/$basearch' }}
对于 Debian (11,12)或 Ubuntu (20.04,22.04),默认使用的软件源如下所示:
- { name: pigsty-local   ,description: 'Pigsty Local'       ,module: local   ,releases: [11,12,20,22,24] ,arch: [x86_64, aarch64] ,baseurl: { default: 'http://${admin_ip}/pigsty ./' }}
- { name: pigsty-pgsql   ,description: 'Pigsty PgSQL'       ,module: pgsql   ,releases: [11,12,20,22,24] ,arch: [x86_64, aarch64] ,baseurl: { default: 'https://repo.pigsty.io/apt/pgsql/${distro_codename} ${distro_codename} main', china: 'https://repo.pigsty.cc/apt/pgsql/${distro_codename} ${distro_codename} main' }}
- { name: pigsty-infra   ,description: 'Pigsty Infra'       ,module: infra   ,releases: [11,12,20,22,24] ,arch: [x86_64, aarch64] ,baseurl: { default: 'https://repo.pigsty.io/apt/infra/ generic main' ,china: 'https://repo.pigsty.cc/apt/infra/ generic main' }}
- { name: nginx          ,description: 'Nginx'              ,module: infra   ,releases: [11,12,20,22,24] ,arch: [x86_64, aarch64] ,baseurl: { default: 'http://nginx.org/packages/${distro_name} ${distro_codename} nginx' }}
- { name: docker-ce      ,description: 'Docker'             ,module: infra   ,releases: [11,12,20,22,24] ,arch: [x86_64, aarch64] ,baseurl: { default: 'https://download.docker.com/linux/${distro_name} ${distro_codename} stable'                               ,china: 'https://mirrors.tuna.tsinghua.edu.cn/docker-ce/linux//${distro_name} ${distro_codename} stable' }}
- { name: base           ,description: 'Debian Basic'       ,module: node    ,releases: [11,12         ] ,arch: [x86_64, aarch64] ,baseurl: { default: 'http://deb.debian.org/debian/ ${distro_codename} main non-free-firmware'                                  ,china: 'https://mirrors.aliyun.com/debian/ ${distro_codename} main restricted universe multiverse' }}
- { name: updates        ,description: 'Debian Updates'     ,module: node    ,releases: [11,12         ] ,arch: [x86_64, aarch64] ,baseurl: { default: 'http://deb.debian.org/debian/ ${distro_codename}-updates main non-free-firmware'                          ,china: 'https://mirrors.aliyun.com/debian/ ${distro_codename}-updates main restricted universe multiverse' }}
- { name: security       ,description: 'Debian Security'    ,module: node    ,releases: [11,12         ] ,arch: [x86_64, aarch64] ,baseurl: { default: 'http://security.debian.org/debian-security ${distro_codename}-security main non-free-firmware'            ,china: 'https://mirrors.aliyun.com/debian-security/ ${distro_codename}-security main non-free-firmware' }}
- { name: base           ,description: 'Ubuntu Basic'       ,module: node    ,releases: [      20,22,24] ,arch: [x86_64         ] ,baseurl: { default: 'https://mirrors.edge.kernel.org/ubuntu/ ${distro_codename}           main universe multiverse restricted' ,china: 'https://mirrors.aliyun.com/ubuntu/ ${distro_codename}           main restricted universe multiverse' }}
- { name: updates        ,description: 'Ubuntu Updates'     ,module: node    ,releases: [      20,22,24] ,arch: [x86_64         ] ,baseurl: { default: 'https://mirrors.edge.kernel.org/ubuntu/ ${distro_codename}-backports main restricted universe multiverse' ,china: 'https://mirrors.aliyun.com/ubuntu/ ${distro_codename}-updates   main restricted universe multiverse' }}
- { name: backports      ,description: 'Ubuntu Backports'   ,module: node    ,releases: [      20,22,24] ,arch: [x86_64         ] ,baseurl: { default: 'https://mirrors.edge.kernel.org/ubuntu/ ${distro_codename}-security  main restricted universe multiverse' ,china: 'https://mirrors.aliyun.com/ubuntu/ ${distro_codename}-backports main restricted universe multiverse' }}
- { name: security       ,description: 'Ubuntu Security'    ,module: node    ,releases: [      20,22,24] ,arch: [x86_64         ] ,baseurl: { default: 'https://mirrors.edge.kernel.org/ubuntu/ ${distro_codename}-updates   main restricted universe multiverse' ,china: 'https://mirrors.aliyun.com/ubuntu/ ${distro_codename}-security  main restricted universe multiverse' }}
- { name: base           ,description: 'Ubuntu Basic'       ,module: node    ,releases: [      20,22,24] ,arch: [        aarch64] ,baseurl: { default: 'http://ports.ubuntu.com/ubuntu-ports/ ${distro_codename}           main universe multiverse restricted'   ,china: 'https://mirrors.aliyun.com/ubuntu-ports/ ${distro_codename}           main restricted universe multiverse' }}
- { name: updates        ,description: 'Ubuntu Updates'     ,module: node    ,releases: [      20,22,24] ,arch: [        aarch64] ,baseurl: { default: 'http://ports.ubuntu.com/ubuntu-ports/ ${distro_codename}-backports main restricted universe multiverse'   ,china: 'https://mirrors.aliyun.com/ubuntu-ports/ ${distro_codename}-updates   main restricted universe multiverse' }}
- { name: backports      ,description: 'Ubuntu Backports'   ,module: node    ,releases: [      20,22,24] ,arch: [        aarch64] ,baseurl: { default: 'http://ports.ubuntu.com/ubuntu-ports/ ${distro_codename}-security  main restricted universe multiverse'   ,china: 'https://mirrors.aliyun.com/ubuntu-ports/ ${distro_codename}-backports main restricted universe multiverse' }}
- { name: security       ,description: 'Ubuntu Security'    ,module: node    ,releases: [      20,22,24] ,arch: [        aarch64] ,baseurl: { default: 'http://ports.ubuntu.com/ubuntu-ports/ ${distro_codename}-updates   main restricted universe multiverse'   ,china: 'https://mirrors.aliyun.com/ubuntu-ports/ ${distro_codename}-security  main restricted universe multiverse' }}
- { name: pgdg           ,description: 'PGDG'               ,module: pgsql   ,releases: [11,12,20,22,24] ,arch: [x86_64, aarch64] ,baseurl: { default: 'http://apt.postgresql.org/pub/repos/apt/ ${distro_codename}-pgdg main' ,china: 'https://mirrors.tuna.tsinghua.edu.cn/postgresql/repos/apt/ ${distro_codename}-pgdg main' }}
- { name: timescaledb    ,description: 'Timescaledb'        ,module: extra   ,releases: [11,12,20,22,24] ,arch: [x86_64, aarch64] ,baseurl: { default: 'https://packagecloud.io/timescale/timescaledb/${distro_name}/ ${distro_codename} main' }}
- { name: citus          ,description: 'Citus'              ,module: extra   ,releases: [11,12,20,22   ] ,arch: [x86_64, aarch64] ,baseurl: { default: 'https://packagecloud.io/citusdata/community/${distro_name}/ ${distro_codename} main' } }
- { name: pgml           ,description: 'PostgresML'         ,module: pgml    ,releases: [         22   ] ,arch: [x86_64, aarch64] ,baseurl: { default: 'https://apt.postgresml.org ${distro_codename} main'  }}
- { name: wiltondb       ,description: 'WiltonDB'           ,module: mssql   ,releases: [      20,22,24] ,arch: [x86_64, aarch64] ,baseurl: { default: 'https://repo.pigsty.io/apt/mssql/ ${distro_codename} main', china: 'https://repo.pigsty.cc/apt/mssql/ ${distro_codename} main' , origin: 'https://ppa.launchpadcontent.net/wiltondb/wiltondb/ubuntu/ ${distro_codename} main'  }}
- { name: groonga        ,description: 'Groonga Debian'     ,module: groonga ,releases: [11,12         ] ,arch: [x86_64, aarch64] ,baseurl: { default: 'https://packages.groonga.org/debian/ ${distro_codename} main' }}
- { name: groonga        ,description: 'Groonga Ubuntu'     ,module: groonga ,releases: [      20,22,24] ,arch: [x86_64, aarch64] ,baseurl: { default: 'https://ppa.launchpadcontent.net/groonga/ppa/ubuntu/ ${distro_codename} main' }}
- { name: mysql          ,description: 'MySQL'              ,module: mysql   ,releases: [11,12,20,22,24] ,arch: [x86_64, aarch64] ,baseurl: { default: 'https://repo.mysql.com/apt/${distro_name} ${distro_codename} mysql-8.0 mysql-tools', china: 'https://mirrors.tuna.tsinghua.edu.cn/mysql/apt/${distro_name} ${distro_codename} mysql-8.0 mysql-tools' }}
- { name: mongo          ,description: 'MongoDB'            ,module: mongo   ,releases: [11,12,20,22,24] ,arch: [x86_64, aarch64] ,baseurl: { default: 'https://repo.mongodb.org/apt/${distro_name} ${distro_codename}/mongodb-org/8.0 multiverse', china: 'https://mirrors.aliyun.com/mongodb/apt/${distro_name} ${distro_codename}/mongodb-org/8.0 multiverse' }}
- { name: redis          ,description: 'Redis'              ,module: redis   ,releases: [11,12,20,22,24] ,arch: [x86_64, aarch64] ,baseurl: { default: 'https://packages.redis.io/deb ${distro_codename} main' }}
- { name: haproxyd       ,description: 'Haproxy Debian'     ,module: haproxy ,releases: [11,12         ] ,arch: [x86_64, aarch64] ,baseurl: { default: 'http://haproxy.debian.net/ ${distro_codename}-backports-3.1 main' }}
- { name: haproxyu       ,description: 'Haproxy Ubuntu'     ,module: haproxy ,releases: [      20,22,24] ,arch: [x86_64, aarch64] ,baseurl: { default: 'https://ppa.launchpadcontent.net/vbernat/haproxy-3.1/ubuntu/ ${distro_codename} main' }}
- { name: grafana        ,description: 'Grafana'            ,module: grafana ,releases: [11,12,20,22,24] ,arch: [x86_64, aarch64] ,baseurl: { default: 'https://apt.grafana.com stable main' ,china: 'https://mirrors.tuna.tsinghua.edu.cn/grafana/apt/ stable main' }}
- { name: kubernetes     ,description: 'Kubernetes'         ,module: kube    ,releases: [11,12,20,22,24] ,arch: [x86_64, aarch64] ,baseurl: { default: 'https://pkgs.k8s.io/core:/stable:/v1.31/deb/ /', china: 'https://mirrors.aliyun.com/kubernetes-new/core/stable/v1.31/deb/ /' }}
- { name: gitlab         ,description: 'Gitlab'             ,module: gitlab  ,releases: [11,12,20,22,24] ,arch: [x86_64, aarch64] ,baseurl: { default: 'https://packages.gitlab.com/gitlab/gitlab-ee/${distro_name}/ ${distro_codename} main' }}
repo_packages
参数名称: repo_packages, 类型: string[], 层次:G
字符串数组类型,每一行都是 由空格分隔 的软件包列表字符串,指定将要使用 repotrack 或 apt download 下载到本地的软件包(及其依赖)。
本参数没有默认值,即默认值为未定义状态。如果该参数没有被显式定义,那么 Pigsty 会从 roles/node_id/vars 中定义的 repo_packages_default 变量中加载获取默认值,默认值为:
[ node-bootstrap, infra-package, infra-addons, node-package1, node-package2, pgsql-utility, extra-modules ]
该参数中的每个元素,都会在上述文件中定义的 package_map 中,根据特定的操作系统发行版大版本进行翻译。例如在 EL 系统上会翻译为:
node-bootstrap:          "ansible python3 python3-pip python3-virtualenv python3-requests python3-jmespath python3-cryptography dnf-utils modulemd-tools createrepo_c sshpass"
infra-package:           "nginx dnsmasq etcd haproxy vip-manager node_exporter keepalived_exporter pg_exporter pgbackrest_exporter redis_exporter redis minio mcli pig"
infra-addons:            "grafana grafana-plugins loki logcli promtail prometheus alertmanager pushgateway blackbox_exporter nginx_exporter pev2 certbot python3-certbot-nginx"
extra-modules:           "docker-ce docker-compose-plugin ferretdb2 duckdb restic juicefs vray grafana-infinity-ds"
node-package1:           "lz4 unzip bzip2 zlib yum pv jq git ncdu make patch bash lsof wget uuid tuned nvme-cli numactl grubby sysstat iotop htop rsync tcpdump perf flamegraph chkconfig"
node-package2:           "netcat socat ftp lrzsz net-tools ipvsadm bind-utils telnet audit ca-certificates readline vim-minimal keepalived chrony openssl openssh-server openssh-clients"
pgsql-utility:           "patroni patroni-etcd pgbouncer pgbackrest pgbadger pg_activity pg_timetable pgFormatter pg_filedump pgxnclient timescaledb-tools timescaledb-event-streamer pgcopydb"
而在 Debian 系统上会被翻译为对应的 Debian DEB 包名:
node-bootstrap:          "ansible python3 python3-pip python3-venv python3-jmespath dpkg-dev sshpass ftp linux-tools-generic"
infra-package:           "nginx dnsmasq etcd haproxy vip-manager node-exporter keepalived-exporter pg-exporter pgbackrest-exporter redis-exporter redis minio mcli pig"
infra-addons:            "grafana grafana-plugins loki logcli promtail prometheus alertmanager pushgateway blackbox-exporter nginx-exporter pev2 certbot python3-certbot-nginx"
extra-modules:           "docker-ce docker-compose-plugin ferretdb2 duckdb restic juicefs vray grafana-infinity-ds"
node-package1:           "lz4 unzip bzip2 zlib1g pv jq git ncdu make patch bash lsof wget uuid tuned nvme-cli numactl sysstat iotop htop rsync tcpdump acl chrony"
node-package2:           "netcat-openbsd socat lrzsz net-tools ipvsadm dnsutils telnet ca-certificates libreadline-dev vim-tiny keepalived openssl openssh-server openssh-client"
pgsql-utility:           "patroni pgbouncer pgbackrest pgbadger pg-activity pg-timetable pgformatter postgresql-filedump pgxnclient timescaledb-tools timescaledb-event-streamer pgcopydb pgloader"
作为一个使用约定,repo_packages 中通常包括了那些与 PostgreSQL 大版本号无关的软件包(例如 Infra,Node 和 PGDG Common 等部分),而 PostgreSQL 大版本相关的软件包(内核,扩展),通常在 repo_extra_packages 中指定,方便用户切换 PG 大版本。
repo_extra_packages
参数名称: repo_extra_packages, 类型: string[], 层次:G/C/I
用于在不修改 repo_packages 的基础上,指定额外需要下载的软件包(通常是 PG 大版本相关的软件包),默认值为空列表。
如果该参数没有被显式定义,那么 Pigsty 会从 roles/node_id/vars 中定义的 repo_extra_packages_default 变量中加载获取默认值,默认值为:
[ pgsql-main ]
该参数中的每个元素,都会在上述文件中定义的 package_map 中,根据特定的操作系统发行版大版本进行翻译。例如在 EL 系统上会翻译为:
postgresql$v postgresql$v-server postgresql$v-libs postgresql$v-contrib postgresql$v-plperl postgresql$v-plpython3 postgresql$v-pltcl postgresql$v-llvmjit pg_repack_$v* wal2json_$v* pgvector_$v*
而在 Debian 系统上会被翻译为对应的 Debian DEB 包名:
postgresql-$v postgresql-client-$v postgresql-plpython3-$v postgresql-plperl-$v postgresql-pltcl-$v postgresql-$v-repack postgresql-$v-wal2json postgresql-$v-pgvector
这里的 $v 会被替换为 pg_version,即当前 PG 大版本号 (默认为 17)。通常用户可以在这里指定 PostgreSQL 大版本相关的软件包,而不影响 repo_packages 中定义的其他 PG 大版本无关的软件包。
repo_url_packages
参数名称: repo_url_packages, 类型: object[] | string[], 层次:G
直接使用 URL 从互联网上下载的软件包,默认为空数组: []
您可以直接在本参数中使用 URL 字符串作为数组元素,也可以使用 Pigsty v3 新引入的对象结构,显式指定 URL 与文件名称。
请注意,本参数会收到 region 变量的影响,如果您在中国大陆地区,Pigsty 会自动将 URL 替换为国内镜像站点,即将 URL 里的 repo.pigsty.io 替换为 repo.pigsty.cc。
INFRA_PACKAGE
这些软件包只会在 INFRA 节点上安装,包括普通的 RPM/DEB 软件包,以及 PIP 软件包。
infra_packages
参数名称: infra_packages, 类型: string[], 层次:G
字符串数组类型,每一行都是 由空格分隔 的软件包列表字符串,指定将要在 Infra 节点上安装的软件包列表。
本参数没有默认值,即默认值为未定义状态。如果用户不在配置文件中显式指定本参数,则 Pigsty 会从根据当前节点的操作系统族,
从定义于 roles/node_id/vars 中的 infra_packages_default 变量中加载获取默认值。
默认值(EL系操作系统):
infra_packages:                   # 将在基础设施节点上安装的软件包列表
  - grafana,loki,logcli,promtail,prometheus,alertmanager,pushgateway,grafana-plugins,restic,certbot,python3-certbot-nginx
  - node_exporter,blackbox_exporter,nginx_exporter,pg_exporter,pev2,nginx,dnsmasq,ansible,etcd,python3-requests,redis,mcli
默认值(Debian/Ubuntu):
infra_packages:                   # 将在基础设施节点上安装的软件包列表
  - grafana,grafana-plugins,loki,logcli,promtail,prometheus,alertmanager,pushgateway,restic,certbot,python3-certbot-nginx
  - node-exporter,blackbox-exporter,nginx-exporter,pg-exporter,pev2,nginx,dnsmasq,ansible,etcd,python3-requests,redis,mcli
infra_packages_pip
参数名称: infra_packages_pip, 类型: string, 层次:G
Infra 节点上要使用 pip 额外安装的软件包,包名使用逗号分隔,默认值是空字符串,即不安装任何额外的 python 包。
NGINX
Pigsty 会通过 Nginx 代理所有的 Web 服务访问:Home Page、Grafana、Prometheus、AlertManager 等等。
以及其他可选的工具,如 PGWe、Jupyter Lab、Pgadmin、Bytebase 等等,还有一些静态资源和报告,如 pev、schemaspy 和 pgbadger。
最重要的是,Nginx 还作为本地软件仓库(Yum/Apt)的 Web 服务器,用于存储和分发 Pigsty 的软件包。 此外,Pigsty 还可以使用 Certbot 自动申请免费的 Nginx SSL 证书,使用真实域名与HTTPS安全地对公网提供服务。
nginx_enabled: true               # 在当前基础设施节点上启用 Nginx?
nginx_exporter_enabled: true      # 在当前基础设施节点上启用 nginx_exporter?
nginx_sslmode: enable             # Nginx 的 SSL 工作模式?disable,enable,enforce
nginx_home: /www                  # Nginx 静态文件目录,默认为:`/www`
nginx_port: 80                    # Nginx 默认监听的端口(提供HTTP服务),默认为 `80`
nginx_ssl_port: 443               # Nginx SSL 默认监听的端口,默认为 `443`
nginx_navbar:                     # Nginx 首页上的导航栏内容
  - { name: CA Cert ,url: '/ca.crt'   ,desc: 'pigsty self-signed ca.crt'   }
  - { name: Package ,url: '/pigsty'   ,desc: 'local yum repo packages'     }
  - { name: PG Logs ,url: '/logs'     ,desc: 'postgres raw csv logs'       }
  - { name: Reports ,url: '/report'   ,desc: 'pgbadger summary report'     }
  - { name: Explain ,url: '/pigsty/pev.html' ,desc: 'postgres explain visualizer' }
certbot_sign: false               # 使用 certbot 自动申请 Nginx SSL 证书?
certbot_email: your@email.com     # certbot 邮箱地址,用于接收证书过期提醒邮件
certbot_options: ''               # certbot 额外选项
nginx_enabled
参数名称: nginx_enabled, 类型: bool, 层次:G/I
是否在当前的 Infra 节点上启用 Nginx?默认值为: true。
nginx_exporter_enabled
参数名称: nginx_exporter_enabled, 类型: bool, 层次:G/I
在此基础设施节点上启用 nginx_exporter ?默认值为: true。
如果禁用此选项,还会一并禁用 /nginx 健康检查 stub,当您安装使用的 Nginx 版本不支持此功能是可以考虑关闭此开关
nginx_sslmode
参数名称: nginx_sslmode, 类型: enum, 层次:G
Nginx 的 SSL工作模式?有三种选择:disable , enable , enforce, 默认值为 enable,即启用 SSL,但不强制使用。
disable:只监听nginx_port指定的端口服务 HTTP 请求。enable:同时会监听nginx_ssl_port指定的端口服务 HTTPS 请求。enforce:所有链接都会被渲染为默认使用https://- 同时 Nginx
infra_portal中除默认服务器外的其他服务器都会自动将 80 端口重定向到 443 端口。
- 同时 Nginx
nginx_home
参数名称: nginx_home, 类型: path, 层次:G
Nginx服务器静态文件目录,默认为: /www
Nginx服务器的根目录,包含静态资源和软件仓库文件。最好不要随意修改此参数,修改时需要与 repo_home 参数保持一致。
nginx_port
参数名称: nginx_port, 类型: port, 层次:G
Nginx 默认监听的端口(提供HTTP服务),默认为 80 端口,最好不要修改这个参数。
当您的服务器 80 端口被占用时,可以考虑修改此参数,但是需要同时修改 repo_endpoint ,
以及 node_repo_local_urls 所使用的端口并与这里保持一致。
nginx_ssl_port
参数名称: nginx_ssl_port, 类型: port, 层次:G
Nginx SSL 默认监听的端口,默认为 443,最好不要修改这个参数。
nginx_navbar
参数名称: nginx_navbar, 类型: index[], 层次:G
Nginx 首页上的导航栏内容,默认值:
nginx_navbar:                     # Nginx 首页上的导航栏内容
  - { name: CA Cert ,url: '/ca.crt'   ,desc: 'pigsty self-signed ca.crt'   }
  - { name: Package ,url: '/pigsty'   ,desc: 'local yum repo packages'     }
  - { name: PG Logs ,url: '/logs'     ,desc: 'postgres raw csv logs'       }
  - { name: Reports ,url: '/report'   ,desc: 'pgbadger summary report'     }
  - { name: Explain ,url: '/pigsty/pev.html' ,desc: 'postgres explain visualizer' }
每一条记录都会被渲染为一个导航链接,链接到 Pigsty 首页的 App 下拉菜单,所有的 App 都是可选的,默认挂载在 Pigsty 默认服务器下的 http://pigsty/ 。
url 参数指定了 App 的 URL PATH,但是如果 URL 中包含 ${grafana} 字符串,它会被自动替换为 infra_portal 中定义的 Grafana 域名。
所以您可以将一些使用 Grafana 的数据应用挂载到 Pigsty 的首页导航栏中。
certbot_sign
参数名称: certbot_sign, 类型: bool, 层次:G/A
是否使用 certbot 自动申请证书?默认值为 false。
当设置为 true 时,Pigsty 将在 infra.yml 和 install.yml 剧本执行过程中(nginx 角色)中,使用 certbot 从 Let’s Encrypt 自动申请免费的 SSL 证书。
在 infra_portal 中定义的域名,如果定义了 certbot 参数,那么 Pigsty 会使用 certbot 申请 domain 域名证书,证书名为 cerbot 参数的值。
如果有多个服务器/域名指定了相同 certbot 参数,那么 Pigsty 会为这些域名合并申请一个证书,并使用 certbot 参数的值作为证书名。
启用此选项需要您:
- 当前节点可以通过公网域名访问到,DNS 解析已经正确指向当前节点的公网 IP
- 当前节点可以访问到 Let’s Encrypt 的 API 接口
此选项默认关闭,您可以在安装完成后执行 make cert 命令来手动执行,它实际会调用渲染的 /etc/nginx/sign-cert 脚本,使用 certbot 更新或申请证书。
certbot_email
参数名称: certbot_email, 类型: string, 层次:G/A
申请证书时使用的 email 地址,用于接收证书过期提醒邮件。默认值为占位邮件地址:your@email.com。
当 certbot_sign 设置为 true 时,建议提供此参数。Let’s Encrypt 会在证书即将过期时向此邮箱发送提醒邮件。
certbot_option
参数名称: certbot_option, 类型: string, 层次:G/A
申请证书时额外传入的配置参数,默认为空字符串。
您可以通过此参数向 certbot 传递额外的命令行选项,例如 --dry-run ,那么 certbot 将不会真正申请证书,而是进行预览和测试。
DNS
Pigsty 默认会在 Infra 节点上启用 DNSMASQ 服务,用于解析一些辅助域名,例如 h.pigsty a.pigsty p.pigsty g.pigsty 等等,以及可选 MinIO 的 sss.pigsty。
解析记录会记录在 Infra 节点的 /etc/hosts.d/default 文件中。 要使用这个 DNS 服务器,您必须将 nameserver <ip> 添加到 /etc/resolv 中,node_dns_servers 参数可以解决这个问题。
dns_enabled: true                 # 在当前基础设施节点上启用 DNSMASQ 服务?
dns_port: 53                      # DNS 服务器监听端口,默认为 `53`
dns_records:                      # 由 dnsmasq 解析的动态 DNS 记录
  - "${admin_ip} h.pigsty a.pigsty p.pigsty g.pigsty"
  - "${admin_ip} api.pigsty adm.pigsty cli.pigsty ddl.pigsty lab.pigsty git.pigsty sss.pigsty wiki.pigsty"
dns_enabled
参数名称: dns_enabled, 类型: bool, 层次:G/I
是否在这个 Infra 节点上启用 DNSMASQ 服务?默认值为: true。
如果你不想使用默认的 DNS 服务器,(比如你已经有了外部的DNS服务器,或者您的供应商不允许您使用 DNS 服务器)可以将此值设置为 false 来禁用它。
并使用 node_default_etc_hosts 和 node_etc_hosts 静态解析记录代替。
dns_port
参数名称: dns_port, 类型: port, 层次:G
DNSMASQ 的默认监听端口,默认是 53,不建议修改 DNS 服务默认端口。
dns_records
参数名称: dns_records, 类型: string[], 层次:G
由 dnsmasq 负责解析的动态 DNS 记录,一般用于将一些辅助域名解析到本地,例如 h.pigsty a.pigsty p.pigsty g.pigsty 等等。这些记录会被写入到基础设置节点的 /etc/hosts.d/default 文件中。
dns_records:                      # 由 dnsmasq 解析的动态 DNS 记录
  - "${admin_ip} h.pigsty a.pigsty p.pigsty g.pigsty"
  - "${admin_ip} api.pigsty adm.pigsty cli.pigsty ddl.pigsty lab.pigsty git.pigsty sss.pigsty wiki.pigsty"
PROMETHEUS
Prometheus 被用作时序数据库,用于存储和分析监控指标数据,进行指标预计算,评估告警规则。
prometheus_enabled: true          # 在当前基础设施节点上启用 Prometheus?
prometheus_clean: true            # 在初始化 Prometheus 的时候清除现有数据?
prometheus_data: /data/prometheus # Prometheus 数据目录,默认为 `/data/prometheus`
prometheus_sd_dir: /etc/prometheus/targets # Prometheus 静态文件服务发现目录
prometheus_sd_interval: 5s        # Prometheus 目标刷新间隔,默认为 `5s`
prometheus_scrape_interval: 10s   # Prometheus 抓取 & 评估间隔,默认为 `10s`
prometheus_scrape_timeout: 8s     # Prometheus 全局抓取超时,默认为 `8s`
prometheus_options: '--storage.tsdb.retention.time=15d' # Prometheus 额外的命令行参数选项
pushgateway_enabled: true         # 在当前基础设施节点上启用 PushGateway?
pushgateway_options: '--persistence.interval=1m' # PushGateway 额外的命令行参数选项
blackbox_enabled: true            # 在当前基础设施节点上启用 Blackbox_Exporter?
blackbox_options: ''              # Blackbox_Exporter 额外的命令行参数选项
alertmanager_enabled: true        # 在当前基础设施节点上启用 Alertmanager?
alertmanager_port: 9093           # Alertmanager 监听端口,默认为 `9093`
alertmanager_options: ''          # Alertmanager 额外的命令行参数选项
exporter_metrics_path: /metrics   # Exporter 指标路径,默认为 `/metrics`
exporter_install: none            # 如何安装 Exporter?none,yum,binary
exporter_repo_url: ''             # 如果通过 yum 安装 Exporter,则指定 yum 仓库文件地址
prometheus_enabled
参数名称: prometheus_enabled, 类型: bool, 层次:G/I
是否在当前 Infra 节点上启用 Prometheus? 默认值为 true,即所有基础设施节点默认都会安装启用 Prometheus。
例如,如果您有多个元节点,默认情况下,Pigsty会在所有元节点上部署Prometheus。如果您想一台用于Prometheus监控指标收集,一台用于Loki日志收集,则可以在其他元节点的实例层次上将此参数设置为false。
prometheus_clean
参数名称: prometheus_clean, 类型: bool, 层次:G/A
是否在执行 Prometheus 初始化的时候清除现有 Prometheus 数据?默认值为 true。
prometheus_data
参数名称: prometheus_data, 类型: path, 层次:G
Prometheus数据库目录, 默认位置为 /data/prometheus。
prometheus_sd_dir
参数名称: prometheus_sd_dir, 类型: path, 层次:G
Prometheus 静态文件服务发现的对象存储目录,默认值为 /etc/prometheus/targets。
prometheus_sd_interval
参数名称: prometheus_sd_interval, 类型: interval, 层次:G
Prometheus 静态文件服务发现的刷新周期,默认值为 5s。
这意味着 Prometheus 每隔这样长的时间就会重新扫描一次 prometheus_sd_dir (默认为:/etc/prometheus/targets 目录),以发现新的监控对象。
prometheus_scrape_interval
参数名称: prometheus_scrape_interval, 类型: interval, 层次:G
Prometheus 全局指标抓取周期, 默认值为 10s。在生产环境,10秒 - 30秒是一个较为合适的抓取周期。如果您需要更精细的的监控数据粒度,则可以调整此参数。
prometheus_scrape_timeout
参数名称: prometheus_scrape_timeout, 类型: interval, 层次:G
Prometheus 全局抓取超时,默认为 8s。
设置抓取超时可以有效避免监控系统查询导致的雪崩,设置原则是,本参数必须小于并接近 prometheus_scrape_interval ,确保每次抓取时长不超过抓取周期。
prometheus_options
参数名称: prometheus_options, 类型: arg, 层次:G
Prometheus 的额外的命令行参数,默认值:--storage.tsdb.retention.time=15d
默认的参数会为 Prometheus 配置一个 15 天的保留期限来限制磁盘使用量。
pushgateway_enabled
参数名称: pushgateway_enabled, 类型: bool, 层次:G/I
是否在当前 Infra 节点上启用 PushGateway? 默认值为 true,即所有基础设施节点默认都会安装启用 PushGateway。
pushgateway_options
参数名称: pushgateway_options, 类型: arg, 层次:G
PushGateway 的额外的命令行参数,默认值:--persistence.interval=1m,即每分钟进行一次持久化操作。
blackbox_enabled
参数名称: blackbox_enabled, 类型: bool, 层次:G/I
是否在当前 Infra 节点上启用 BlackboxExporter ? 默认值为 true,即所有基础设施节点默认都会安装启用 BlackboxExporter 。
BlackboxExporter 会向节点 IP 地址, VIP 地址,PostgreSQL VIP 地址发送 ICMP 报文测试网络连通性。
blackbox_options
参数名称: blackbox_options, 类型: arg, 层次:G
BlackboxExporter 的额外的命令行参数,默认值:空字符串。
alertmanager_enabled
参数名称: alertmanager_enabled, 类型: bool, 层次:G/I
是否在当前 Infra 节点上启用 AlertManager ? 默认值为 true,即所有基础设施节点默认都会安装启用 AlertManager 。
alertmanager_port
参数名称: alertmanager_port, 类型: port, 层次:G
AlertManager 的监听端口,默认值为 9093。
之所以允许特殊设置 AlertManager 的端口号,是因为 Kafka 的默认端口用到了 9093,容易出现冲突。
alertmanager_options
参数名称: alertmanager_options, 类型: arg, 层次:G
AlertManager 的额外的命令行参数,默认值:空字符串。
exporter_metrics_path
参数名称: exporter_metrics_path, 类型: path, 层次:G
监控 exporter 暴露指标的 HTTP 端点路径,默认为: /metrics ,不建议修改此参数。
exporter_install
参数名称: exporter_install, 类型: enum, 层次:G
(弃用参数)安装监控组件的方式,有三种可行选项:none, yum, binary
指明安装Exporter的方式:
none:不安装,(默认行为,Exporter已经在先前由node_pkg任务完成安装)yum:使用yum(apt)安装(如果启用yum安装,在部署Exporter前执行yum安装node_exporter与pg_exporter)binary:使用拷贝二进制的方式安装(从元节点中直接拷贝node_exporter与pg_exporter二进制,不推荐)
使用yum安装时,如果指定了exporter_repo_url(不为空),在执行安装时会首先将该URL下的REPO文件安装至/etc/yum.repos.d中。这一功能可以在不执行节点基础设施初始化的环境下直接进行Exporter的安装。
不推荐普通用户使用binary安装,这种模式通常用于紧急故障抢修与临时问题修复。
exporter_repo_url
参数名称: exporter_repo_url, 类型: url, 层次:G
(弃用参数)监控组件的 Yum Repo URL
默认为空,当 exporter_install 为 yum 时,该参数指定的Repo会被添加至节点源列表中。
GRAFANA
Pigsty 使用 Grafana 作为监控系统前端。它也可以做为数据分析与可视化平台,或者用于低代码数据应用开发,制作数据应用原型等目的。
grafana_enabled: true             # enable grafana on this infra node?
grafana_clean: true               # clean grafana data during init?
grafana_admin_username: admin     # grafana admin username, `admin` by default
grafana_admin_password: pigsty    # grafana admin password, `pigsty` by default
loki_enabled: true                # enable loki on this infra node?
loki_clean: false                 # whether remove existing loki data?
loki_data: /data/loki             # loki data dir, `/data/loki` by default
loki_retention: 15d               # loki log retention period, 15d by default
grafana_enabled
参数名称: grafana_enabled, 类型: bool, 层次:G/I
是否在Infra节点上启用Grafana?默认值为: true,即所有基础设施节点默认都会安装启用 Grafana。
grafana_clean
参数名称: grafana_clean, 类型: bool, 层次:G/A
是否在初始化 Grafana 时一并清理其数据文件?默认为:true。
该操作会移除 /var/lib/grafana/grafana.db,确保 Grafana 全新安装。
grafana_admin_username
参数名称: grafana_admin_username, 类型: username, 层次:G
Grafana管理员用户名,admin by default
grafana_admin_password
参数名称: grafana_admin_password, 类型: password, 层次:G
Grafana管理员密码,pigsty by default
提示:请务必在生产部署中修改此密码参数!
LOKI
Loki 是Grafana提供的轻量级日志收集/检索平台,它可以提供一个集中查询服务器/数据库日志的地方。
loki_enabled
参数名称: loki_enabled, 类型: bool, 层次:G/I
是否在当前 Infra 节点上启用 Loki ? 默认值为 true,即所有基础设施节点默认都会安装启用 Loki 。
loki_clean
参数名称: loki_clean, 类型: bool, 层次:G/A
是否在安装Loki时清理数据库目录?默认值: false,现有日志数据在初始化时会保留。
loki_data
参数名称: loki_data, 类型: path, 层次:G
Loki的数据目录,默认值为: /data/loki
loki_retention
参数名称: loki_retention, 类型: interval, 层次:G
Loki日志默认保留天数,默认保留 15d 。
4 - 预置剧本
Pigsty 提供了三个与 INFRA 模块相关的剧本:
infra.yml:在 infra 节点上初始化 pigsty 基础设施infra-rm.yml:从 infra 节点移除基础设施组件install.yml:在当前节点上一次性完整安装 Pigsty
infra.yml
INFRA 模块剧本 infra.yml 用于在配置文件的 infra 分组所定义的 Infra节点 上初始化基础设施模块
执行该剧本将完成以下任务
- 配置 Infra节点 的目录与环境变量
- 下载并创建本地软件仓库,加速后续安装。(若使用离线软件包,或检测到已经存在本地软件源,则跳过本阶段)
- 将当前 Infra节点 作为一个 普通节点 纳入 Pigsty 管理
- 部署基础设施组件,包括 Prometheus, Grafana, Loki, Alertmanager, PushGateway,Blackbox Exporter 等
该剧本默认在 infra 分组上执行
- Pigsty 会在配置文件中固定名为
infra的分组上安装INFRA模块 - Pigsty 会在 configure 过程中默认将当前安装节点标记为 Infra节点,并使用 当前节点首要IP地址 替换配置模板中的占位IP地址
10.10.10.10。 - 该节点除了可以发起管理,部署有基础设施,与一个部署普通托管节点并无区别。
剧本注意事项
- 本剧本为幂等剧本,重复执行会 抹除 Infra节点 上的基础设施组件。
- 除非设置
prometheus_clean为false,否则 Prometheus 监控指标时序数据会丢失。 - 除非设置
loki_clean为false,否则 Loki 日志数据会丢失, - 除非设置
grafana_clean为false,否则 Grafana 监控面板与配置修改会丢失
- 除非设置
- 当本地软件仓库
/www/pigsty/repo_complete存在时,本剧本会跳过从互联网下载软件的任务。- 完整执行该剧本耗时约1~3分钟,视机器配置与网络条件而异。
- 不使用离线软件包而直接从互联网原始上游下载软件时,可能耗时5-10分钟,根据您的网络条件而异。
执行演示

可用任务
以下为 infra.yml 剧本中可用的任务列表:
#--------------------------------------------------------------#
# Tasks
#--------------------------------------------------------------#
# ca            : create self-signed CA on localhost files/pki
#   - ca_dir        : create CA directory
#   - ca_private    : generate ca private key: files/pki/ca/ca.key
#   - ca_cert       : signing ca cert: files/pki/ca/ca.crt
#
# id            : generate node identity
#
# repo          : bootstrap a local yum repo from internet or offline packages
#   - repo_dir      : create repo directory
#   - repo_check    : check repo exists
#   - repo_prepare  : use existing repo if exists
#   - repo_build    : build repo from upstream if not exists
#     - repo_upstream    : handle upstream repo files in /etc/yum.repos.d
#       - repo_remove    : remove existing repo file if repo_remove == true
#       - repo_add       : add upstream repo files to /etc/yum.repos.d
#     - repo_url_pkg     : download packages from internet defined by repo_url_packages
#     - repo_cache       : make upstream yum cache with yum makecache
#     - repo_boot_pkg    : install bootstrap pkg such as createrepo_c,yum-utils,...
#     - repo_pkg         : download packages & dependencies from upstream repo
#     - repo_create      : create a local yum repo with createrepo_c & modifyrepo_c
#     - repo_use         : add newly built repo into /etc/yum.repos.d
#   - repo_nginx    : launch a nginx for repo if no nginx is serving
#
# node/haproxy/docker/monitor : setup infra node as a common node (check node.yml)
#   - node_name, node_hosts, node_resolv, node_firewall, node_ca, node_repo, node_pkg
#   - node_feature, node_kernel, node_tune, node_sysctl, node_profile, node_ulimit
#   - node_data, node_admin, node_timezone, node_ntp, node_crontab, node_vip
#   - haproxy_install, haproxy_config, haproxy_launch, haproxy_reload
#   - docker_install, docker_admin, docker_config, docker_launch, docker_image
#   - haproxy_register, node_exporter, node_register, promtail
#
# infra         : setup infra components
#   - infra_env      : env_dir, env_pg, env_pgadmin, env_var
#   - infra_pkg      : infra_pkg_yum, infra_pkg_pip
#   - infra_user     : setup infra os user group
#   - infra_cert     : issue cert for infra components
#   - dns            : dns_config, dns_record, dns_launch
#   - nginx          : nginx_config, nginx_cert, nginx_static, nginx_launch, nginx_certbot, nginx_reload, nginx_exporter
#   - prometheus     : prometheus_clean, prometheus_dir, prometheus_config, prometheus_launch, prometheus_reload
#   - alertmanager   : alertmanager_config, alertmanager_launch
#   - pushgateway    : pushgateway_config, pushgateway_launch
#   - blackbox       : blackbox_config, blackbox_launch
#   - grafana        : grafana_clean, grafana_config, grafana_launch, grafana_provision
#   - loki           : loki clean, loki_dir, loki_config, loki_launch
#   - infra_register : register infra components to prometheus
#--------------------------------------------------------------#
infra-rm.yml
INFRA模块剧本 infra-rm.yml 用于从配置文件 infra 分组定义的 Infra节点 上移除 Pigsty 基础设施
常用子任务包括:
./infra-rm.yml               # 移除 INFRA 模块
./infra-rm.yml -t service    # 停止 INFRA 上的基础设施服务
./infra-rm.yml -t data       # 移除 INFRA 上的存留数据
./infra-rm.yml -t package    # 卸载 INFRA 上安装的软件包
install.yml
INFRA模块剧本 install.yml用于在 所有节点 上一次性完整安装 Pigsty。
该剧本在 剧本:一次性安装 中有更详细的介绍。
5 - 管理预案
下面是与 INFRA 模块相关的一些管理任务:
安装Infra模块
使用 infra.yml 剧本在 Infra 节点上安装 INFRA 模块:
./infra.yml # 在 infra 分组上安装 INFRA 模块
卸载Infra模块
使用 infra-rm.yml 剧本从 Infra 节点上卸载 INFRA 模块:
./infra-rm.yml # 从 infra 分组上卸载 INFRA 模块
扩容 Infra 模块
想要扩容现有 Infra 部署,首先修改 infra 分组,添加新的节点 IP,并为其分配不重复的 Infra 实例号 infra_seq。
all:
  children:
    infra:
      hosts:
        10.10.10.10: { infra_seq: 1 } # 原有的 1 号节点
        10.10.10.11: { infra_seq: 2 } # 新的 2 号节点
然后使用 infra.yml 剧本在新的节点上安装 INFRA 模块:
./infra.yml -l 10.10.10.11 # 在新节点上安装 INFRA 模块
管理本地软件仓库
您可以使用以下剧本子任务,管理 Infra节点 上的本地软件仓库(YUM/APT):
./infra.yml -t repo              #从互联网或离线包中创建本地软件仓库

./infra.yml -t repo_dir          # 创建本地软件仓库
./infra.yml -t repo_check        # 检查本地软件仓库是否已经存在?
./infra.yml -t repo_prepare      # 如果存在,直接使用已有的本地软件仓库
./infra.yml -t repo_build        # 如果不存在,从上游构建本地软件仓库
./infra.yml     -t repo_upstream     # 添加上游仓库 repo/list 文件
./infra.yml     -t repo_remove       # 如果 repo_remove == true,则删除现有的仓库文件
./infra.yml     -t repo_add          # 将上游仓库文件添加到 /etc/yum.repos.d (或 /etc/apt/sources.list.d)
./infra.yml     -t repo_url_pkg      # 从由 repo_url_packages 定义的互联网下载包
./infra.yml     -t repo_cache        # 使用 yum makecache / apt update 创建上游软件源元数据缓存
./infra.yml     -t repo_boot_pkg     # 安装如 createrepo_c、yum-utils 等的引导包...(或 dpkg-)
./infra.yml     -t repo_pkg          # 从上游仓库下载包 & 依赖项
./infra.yml     -t repo_create       # 使用 createrepo_c & modifyrepo_c / dpkg-dev 创建本地软件仓库
./infra.yml     -t repo_use          # 将新建的仓库添加到 /etc/yum.repos.d | /etc/apt/sources.list.d
./infra.yml -t repo_nginx        # 如果 nginx 没有运行,启动 nginx 作为文件服务器
其中常用的命令为:
./infra.yml     -t repo_upstream     # 向 INFRA 节点添加 repo_upstream 中定义的上游软件仓库
./infra.yml     -t repo_pkg          # 从上游软件仓库下载包及其依赖项。
./infra.yml     -t repo_create       # 创建/更新本地 yum/apt 仓库
管理Nginx
./infra.yml -t nginx                       # 重置 Nginx 组件
./infra.yml -t nginx_index                 # 重新渲染 Nginx 首页内容
./infra.yml -t nginx_config,nginx_reload   # 重新渲染 Nginx 配置,对外暴露新的上游服务。
如果用户在 infra_portal 列表中使用了 certbot 字段填入了证书名称,则可以使用以下命令使用 certbot 申请免费 HTTPS 证书:
# 使用 certbot 申请真实域名的免费 HTTPS 证书
./infra.yml -t nginx_certbot,nginx_reload -e certbot_sign=true
管理基础设施组件
您可以使用以下剧本子任务,管理 Infra节点 上的各个基础设施组件
./infra.yml -t infra           # 配置基础设施
./infra.yml -t infra_env       # 配置管理节点上的环境变量:env_dir, env_pg, env_pgadmin, env_var
./infra.yml -t infra_pkg       # 安装INFRA所需的软件包:infra_pkg_yum, infra_pkg_pip
./infra.yml -t infra_user      # 设置 infra 操作系统用户组
./infra.yml -t infra_cert      # 为 infra 组件颁发证书
./infra.yml -t dns             # 配置 DNSMasq:dns_config, dns_record, dns_launch
./infra.yml -t nginx           # 配置 Nginx:nginx_config, nginx_cert, nginx_static, nginx_launch, nginx_exporter
./infra.yml -t prometheus      # 配置 Prometheus:prometheus_clean, prometheus_dir, prometheus_config, prometheus_launch, prometheus_reload
./infra.yml -t alertmanager    # 配置 AlertManager:alertmanager_config, alertmanager_launch
./infra.yml -t pushgateway     # 配置 PushGateway:pushgateway_config, pushgateway_launch
./infra.yml -t blackbox        # 配置 Blackbox Exporter: blackbox_launch
./infra.yml -t grafana         # 配置 Grafana:grafana_clean, grafana_config, grafana_plugin, grafana_launch, grafana_provision
./infra.yml -t loki            # 配置 Loki:loki_clean, loki_dir, loki_config, loki_launch
./infra.yml -t infra_register  # 将 infra 组件注册到 prometheus
其他常用的任务包括:
./infra.yml -t nginx_index                        # 重新渲染 Nginx 首页内容
./infra.yml -t nginx_config,nginx_reload          # 重新渲染 Nginx 配置,对外暴露新的上游服务。
./infra.yml -t prometheus_conf,prometheus_reload  # 重新生成 Prometheus 主配置文件,并重载配置
./infra.yml -t prometheus_rule,prometheus_reload  # 重新拷贝 Prometheus 规则 & 告警,并重载配置
./infra.yml -t grafana_plugin                     # 从互联网上下载 Grafana 插件,通常需要科学上网
6 - 监控告警
监控面板
Pigsty 针对 Infra 模块提供了以下监控面板
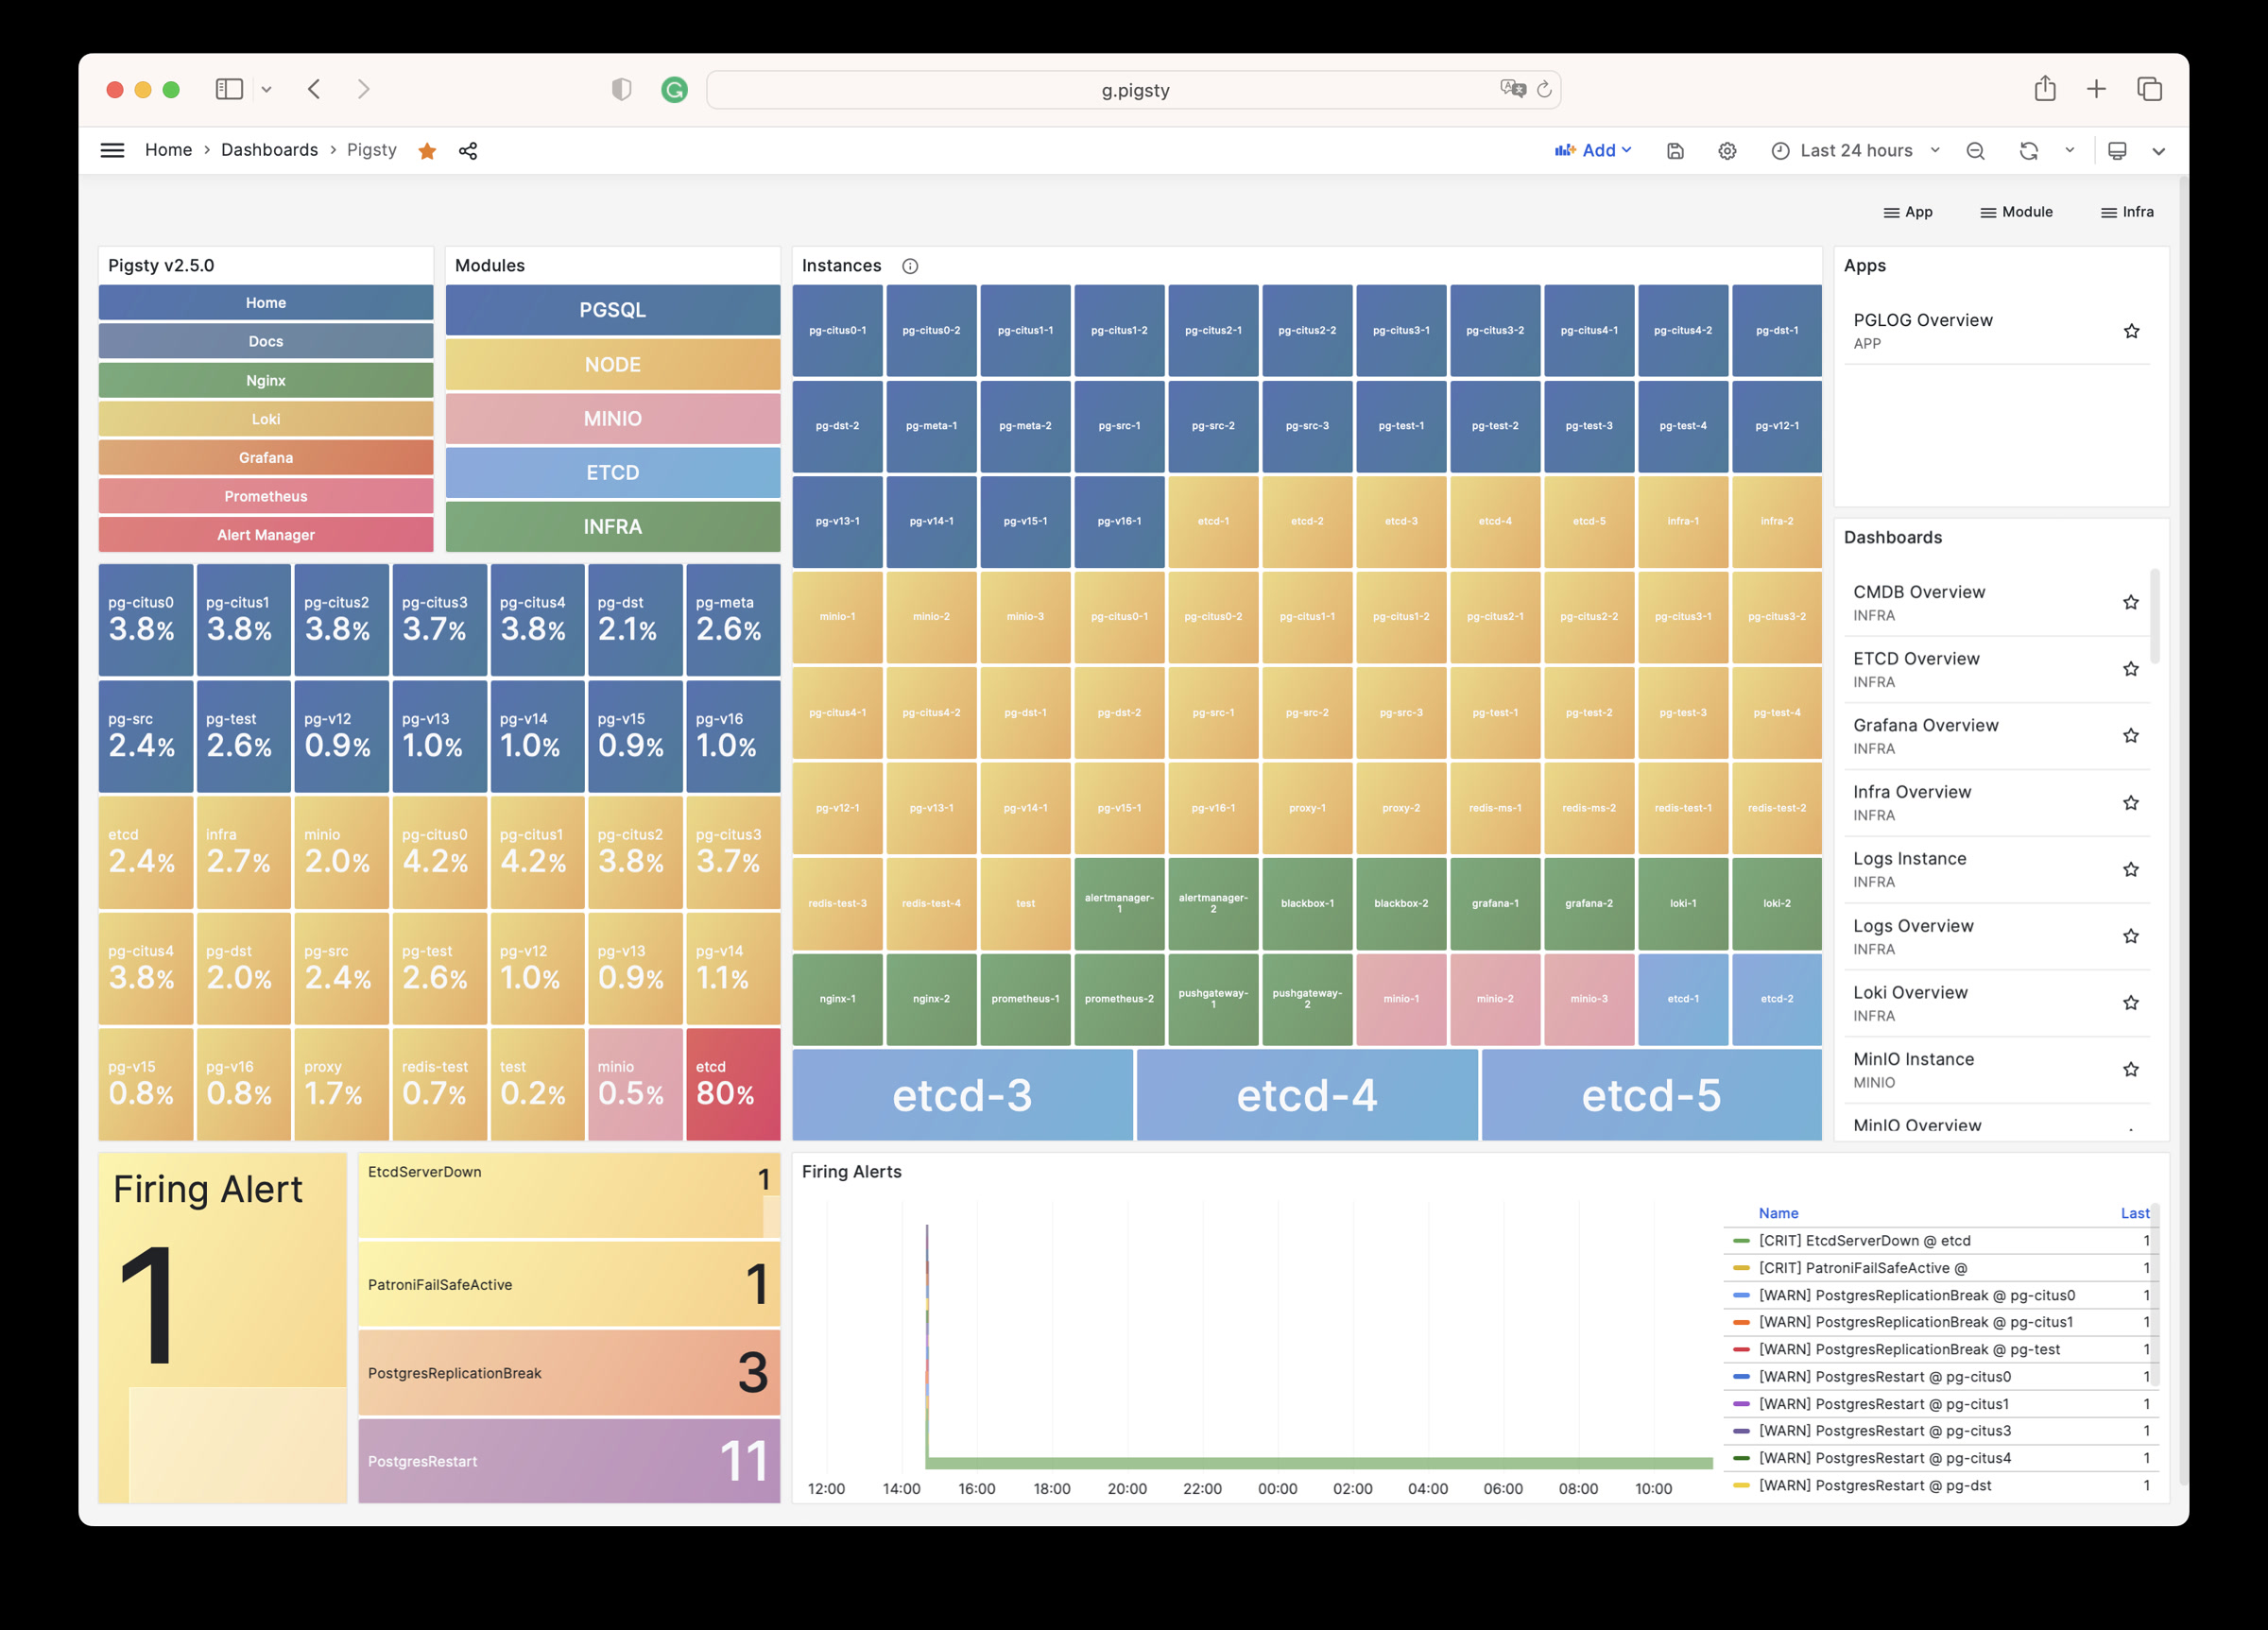
Pigsty Home
Pigsty 监控系统主页
Pigsty Home Dashboard
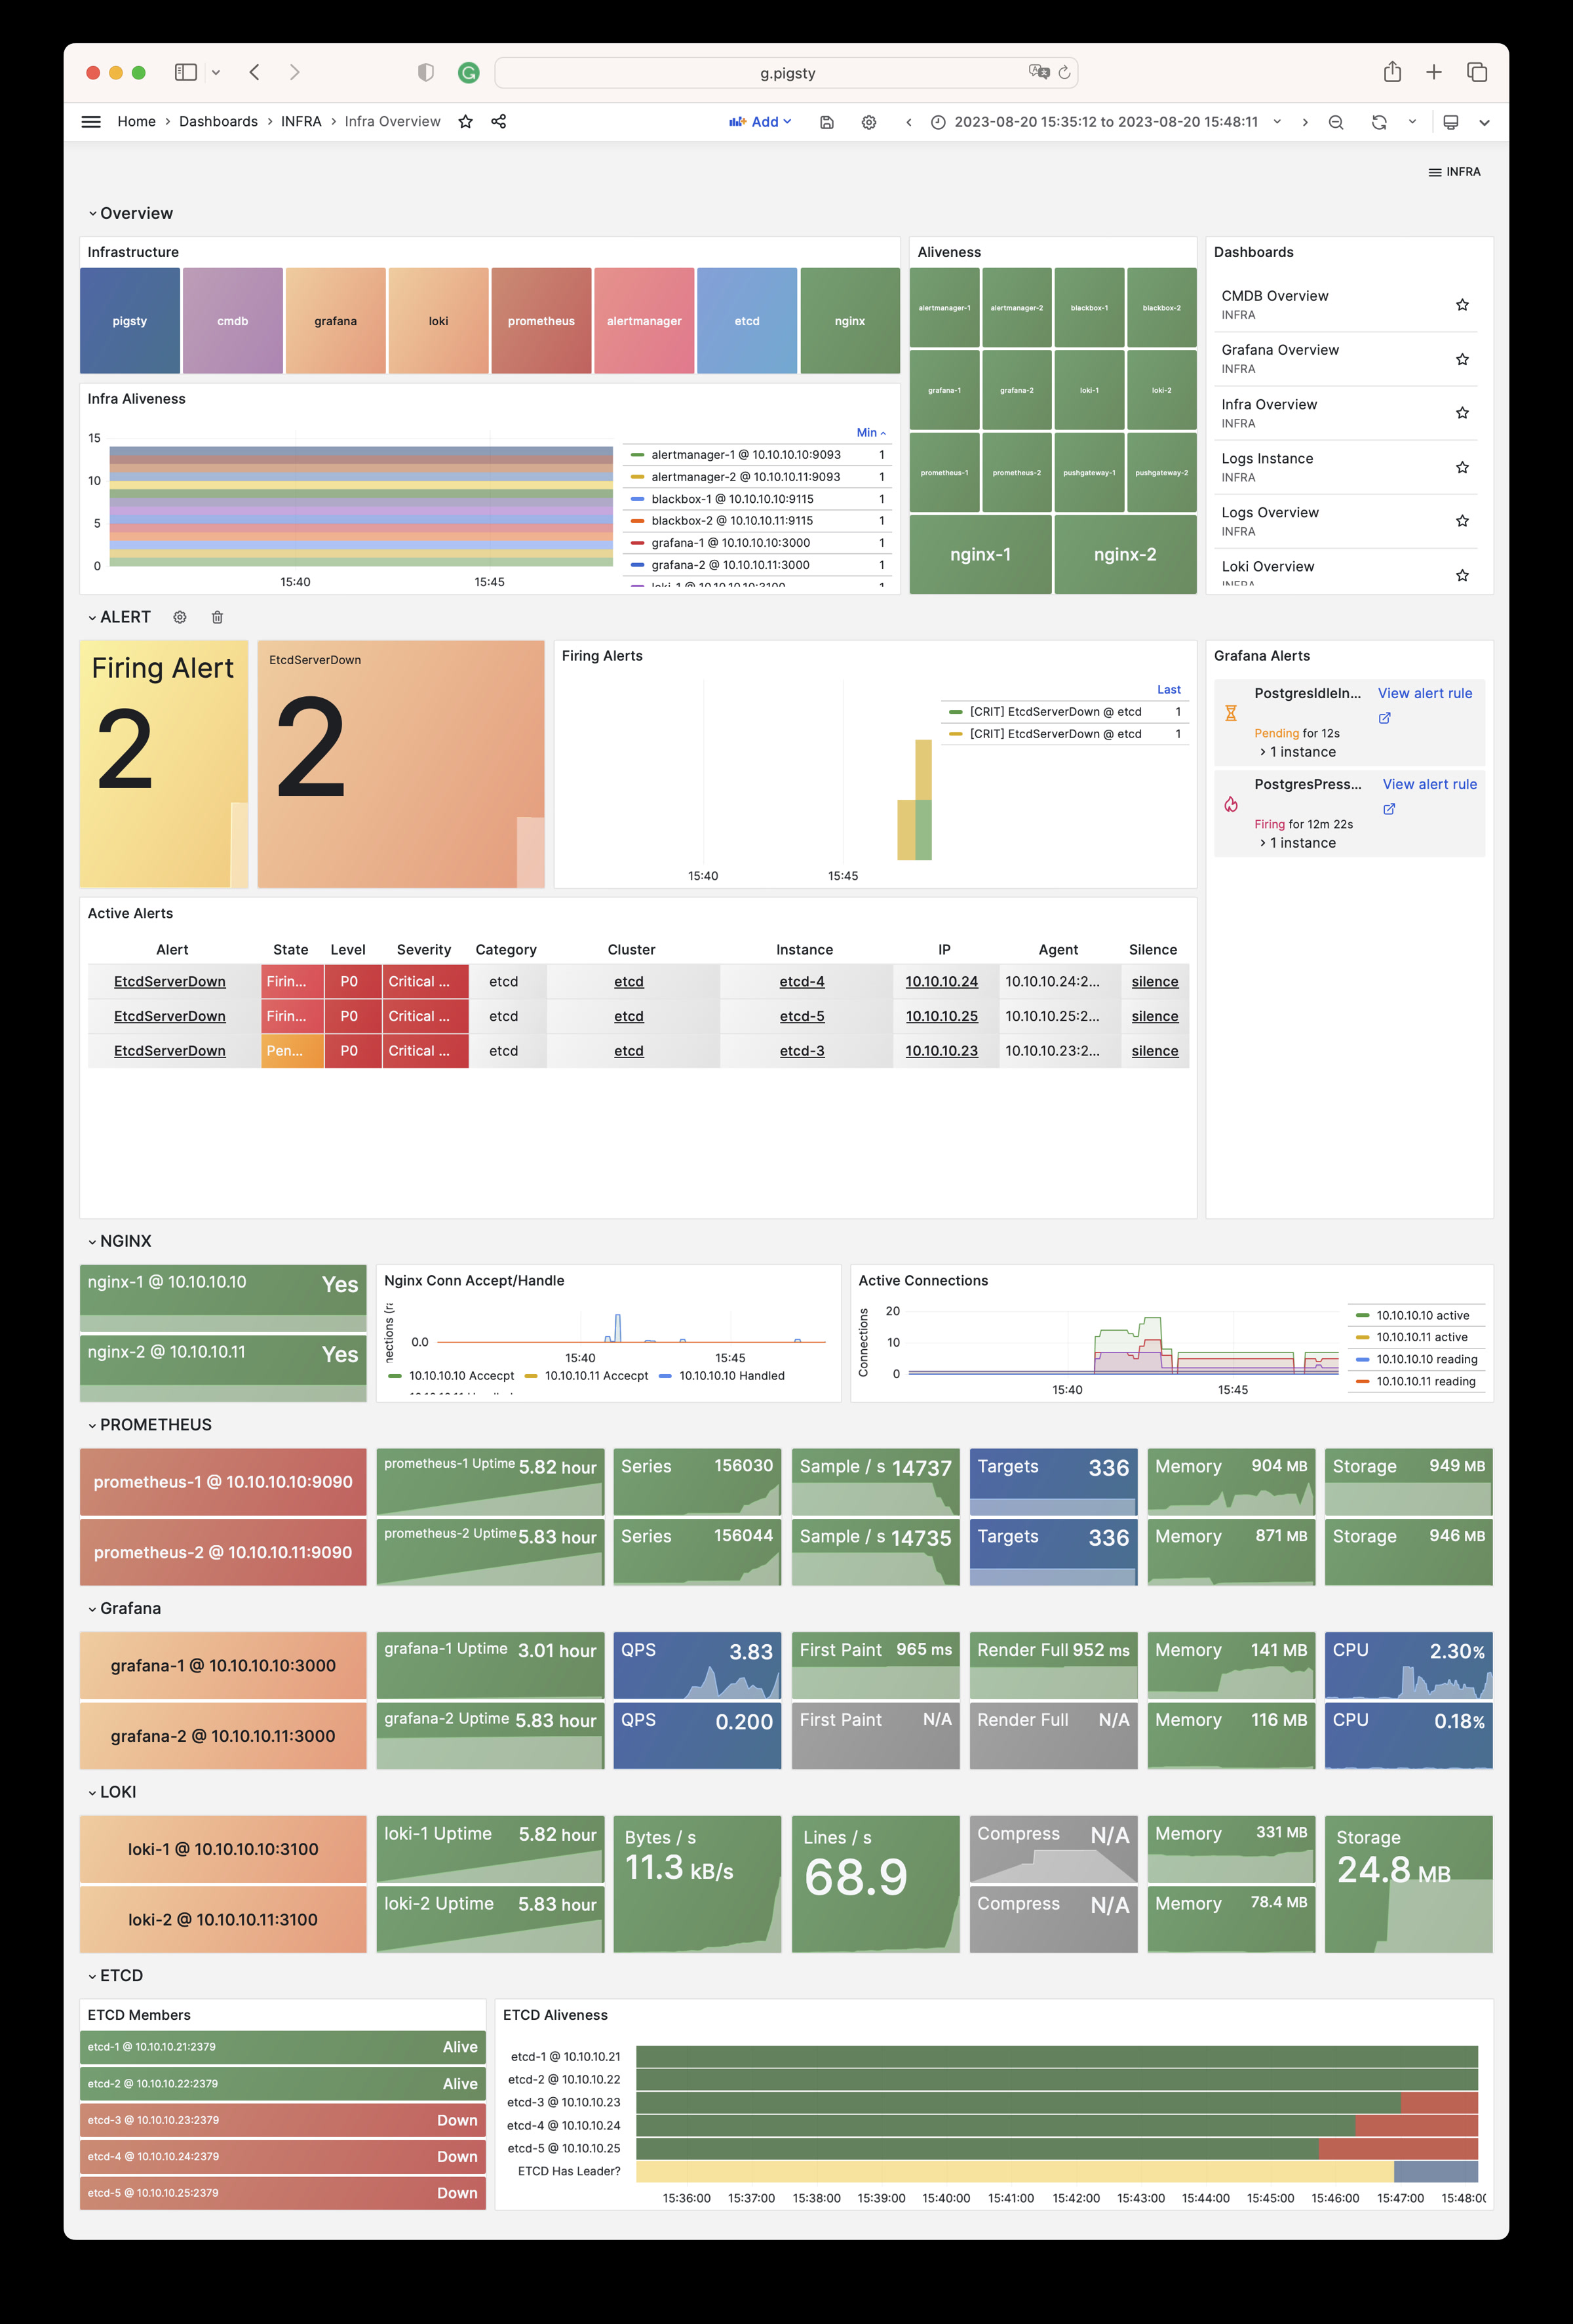
INFRA Overview
Pigsty 基础设施自监控概览
INFRA Overview Dashboard
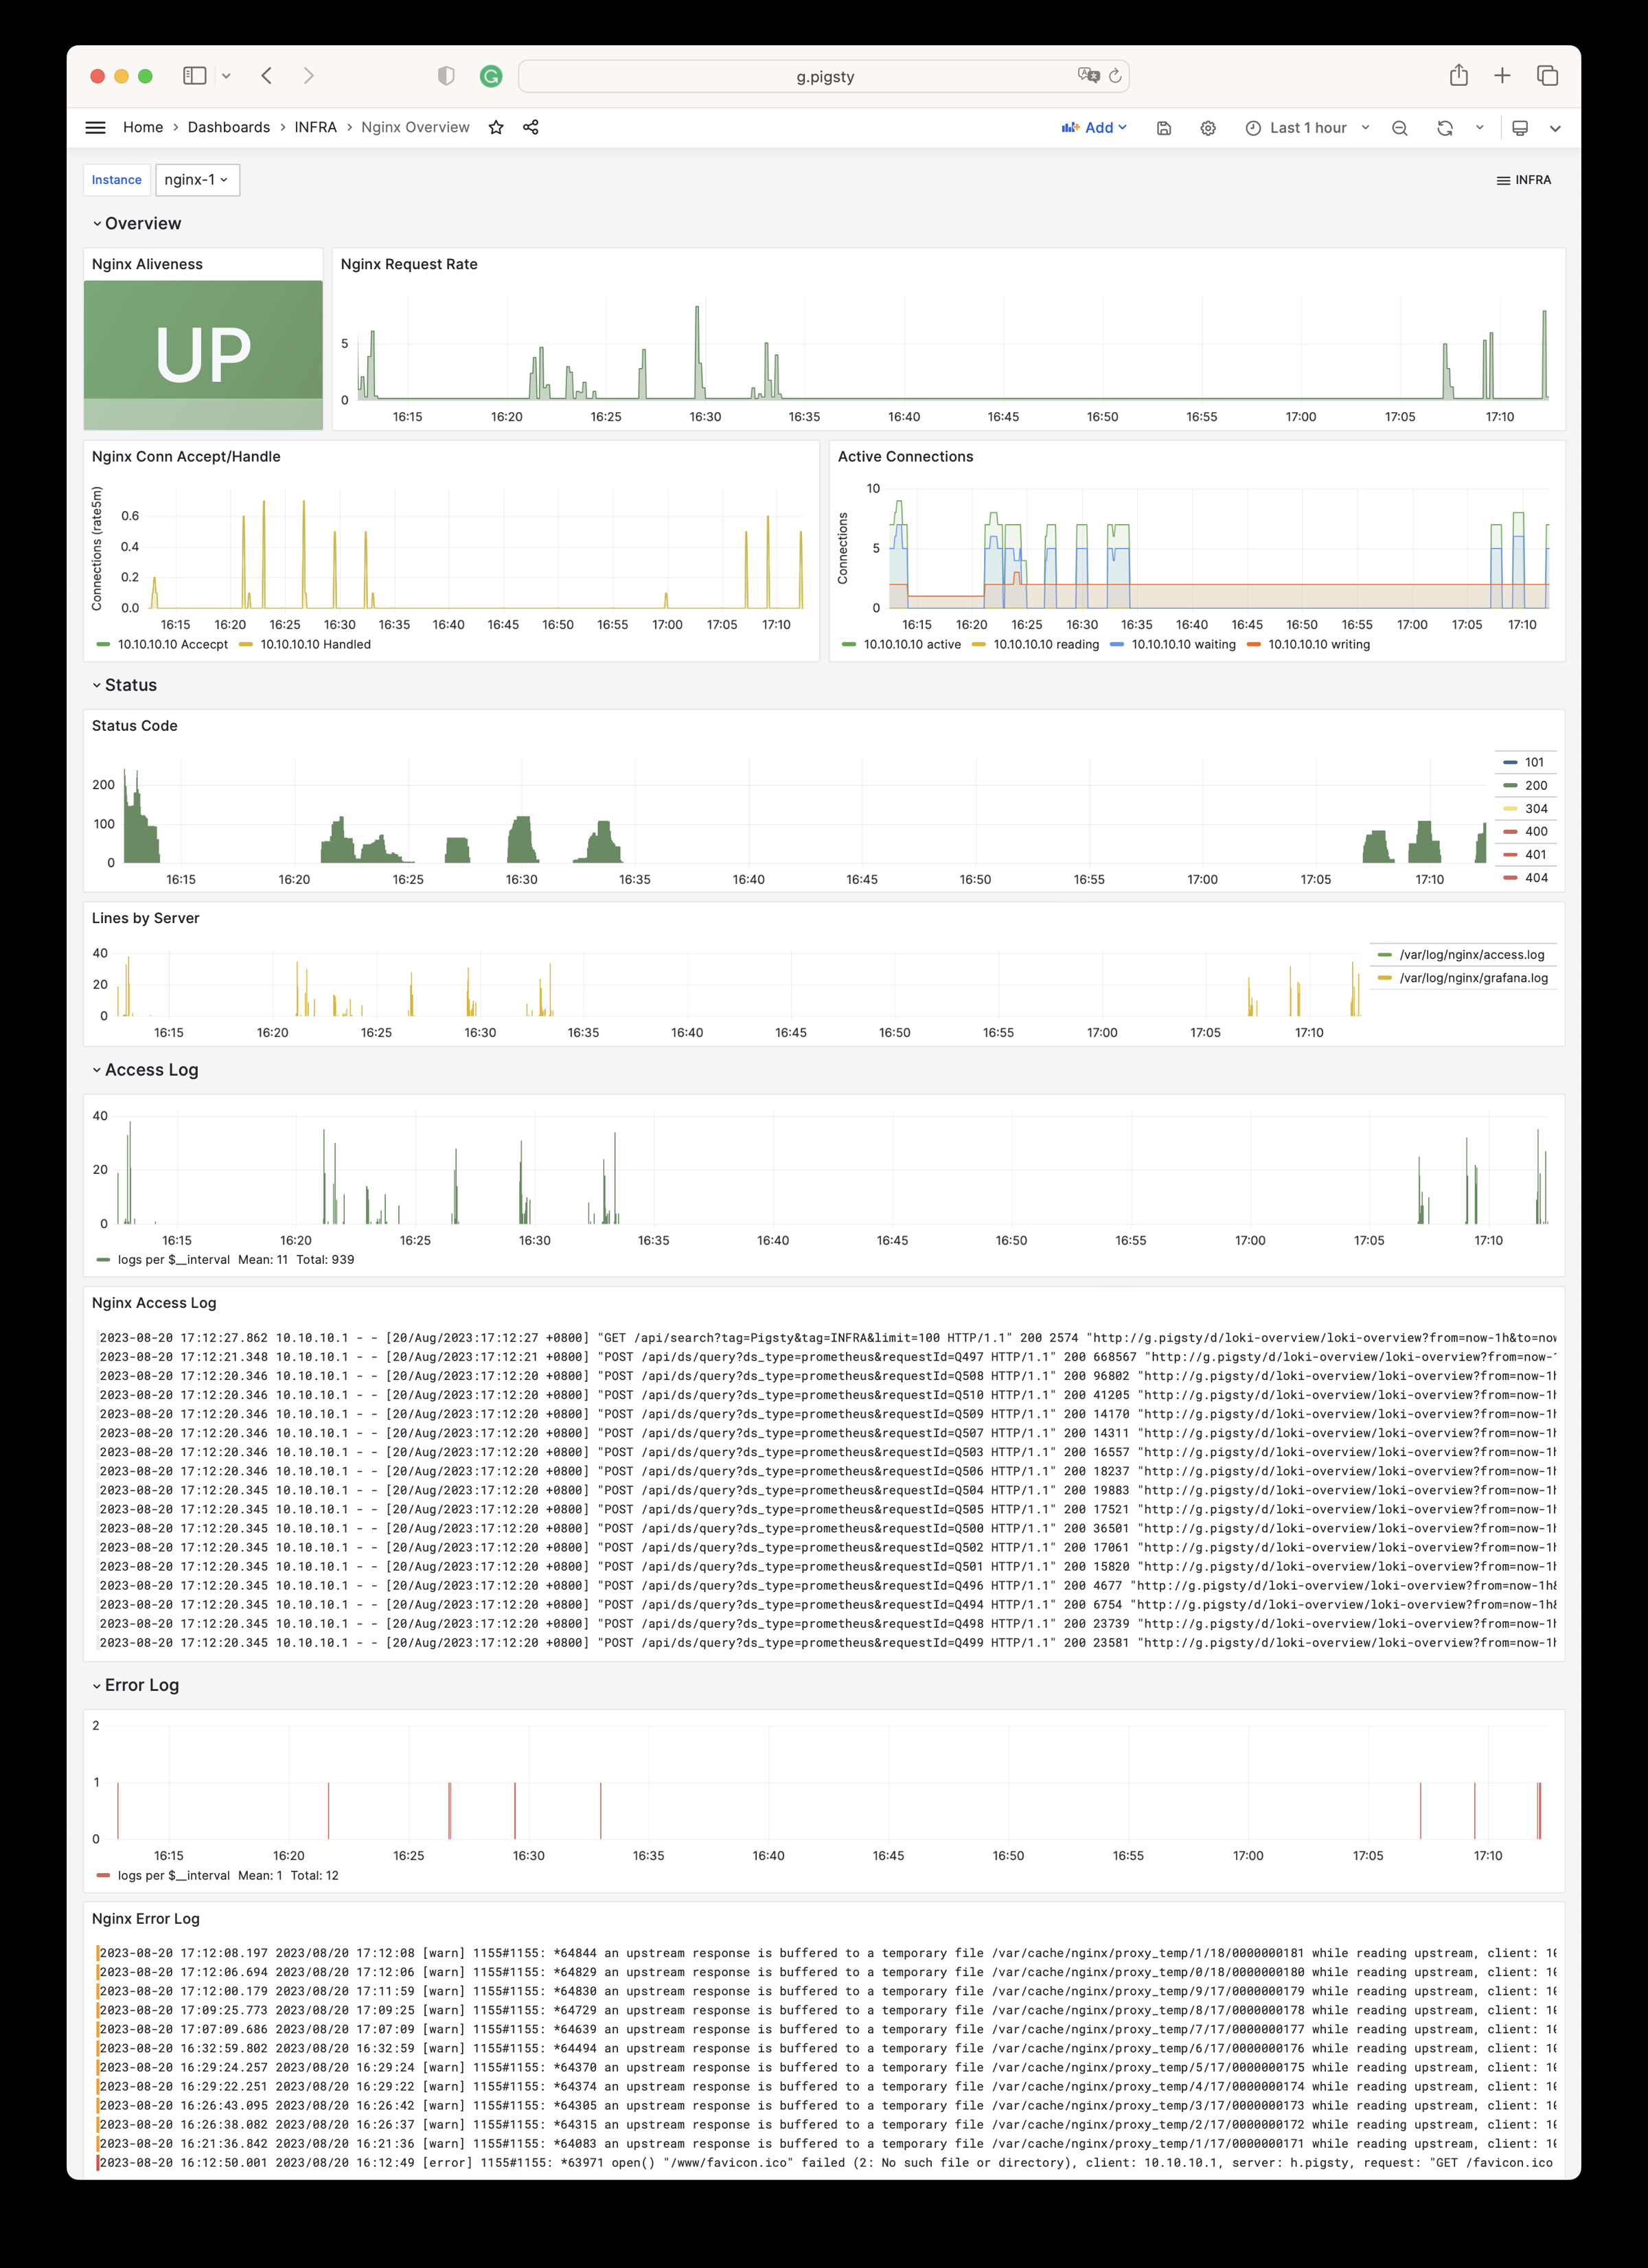
Nginx Overview
Nginx 监控指标与日志
Nginx Overview Dashboard
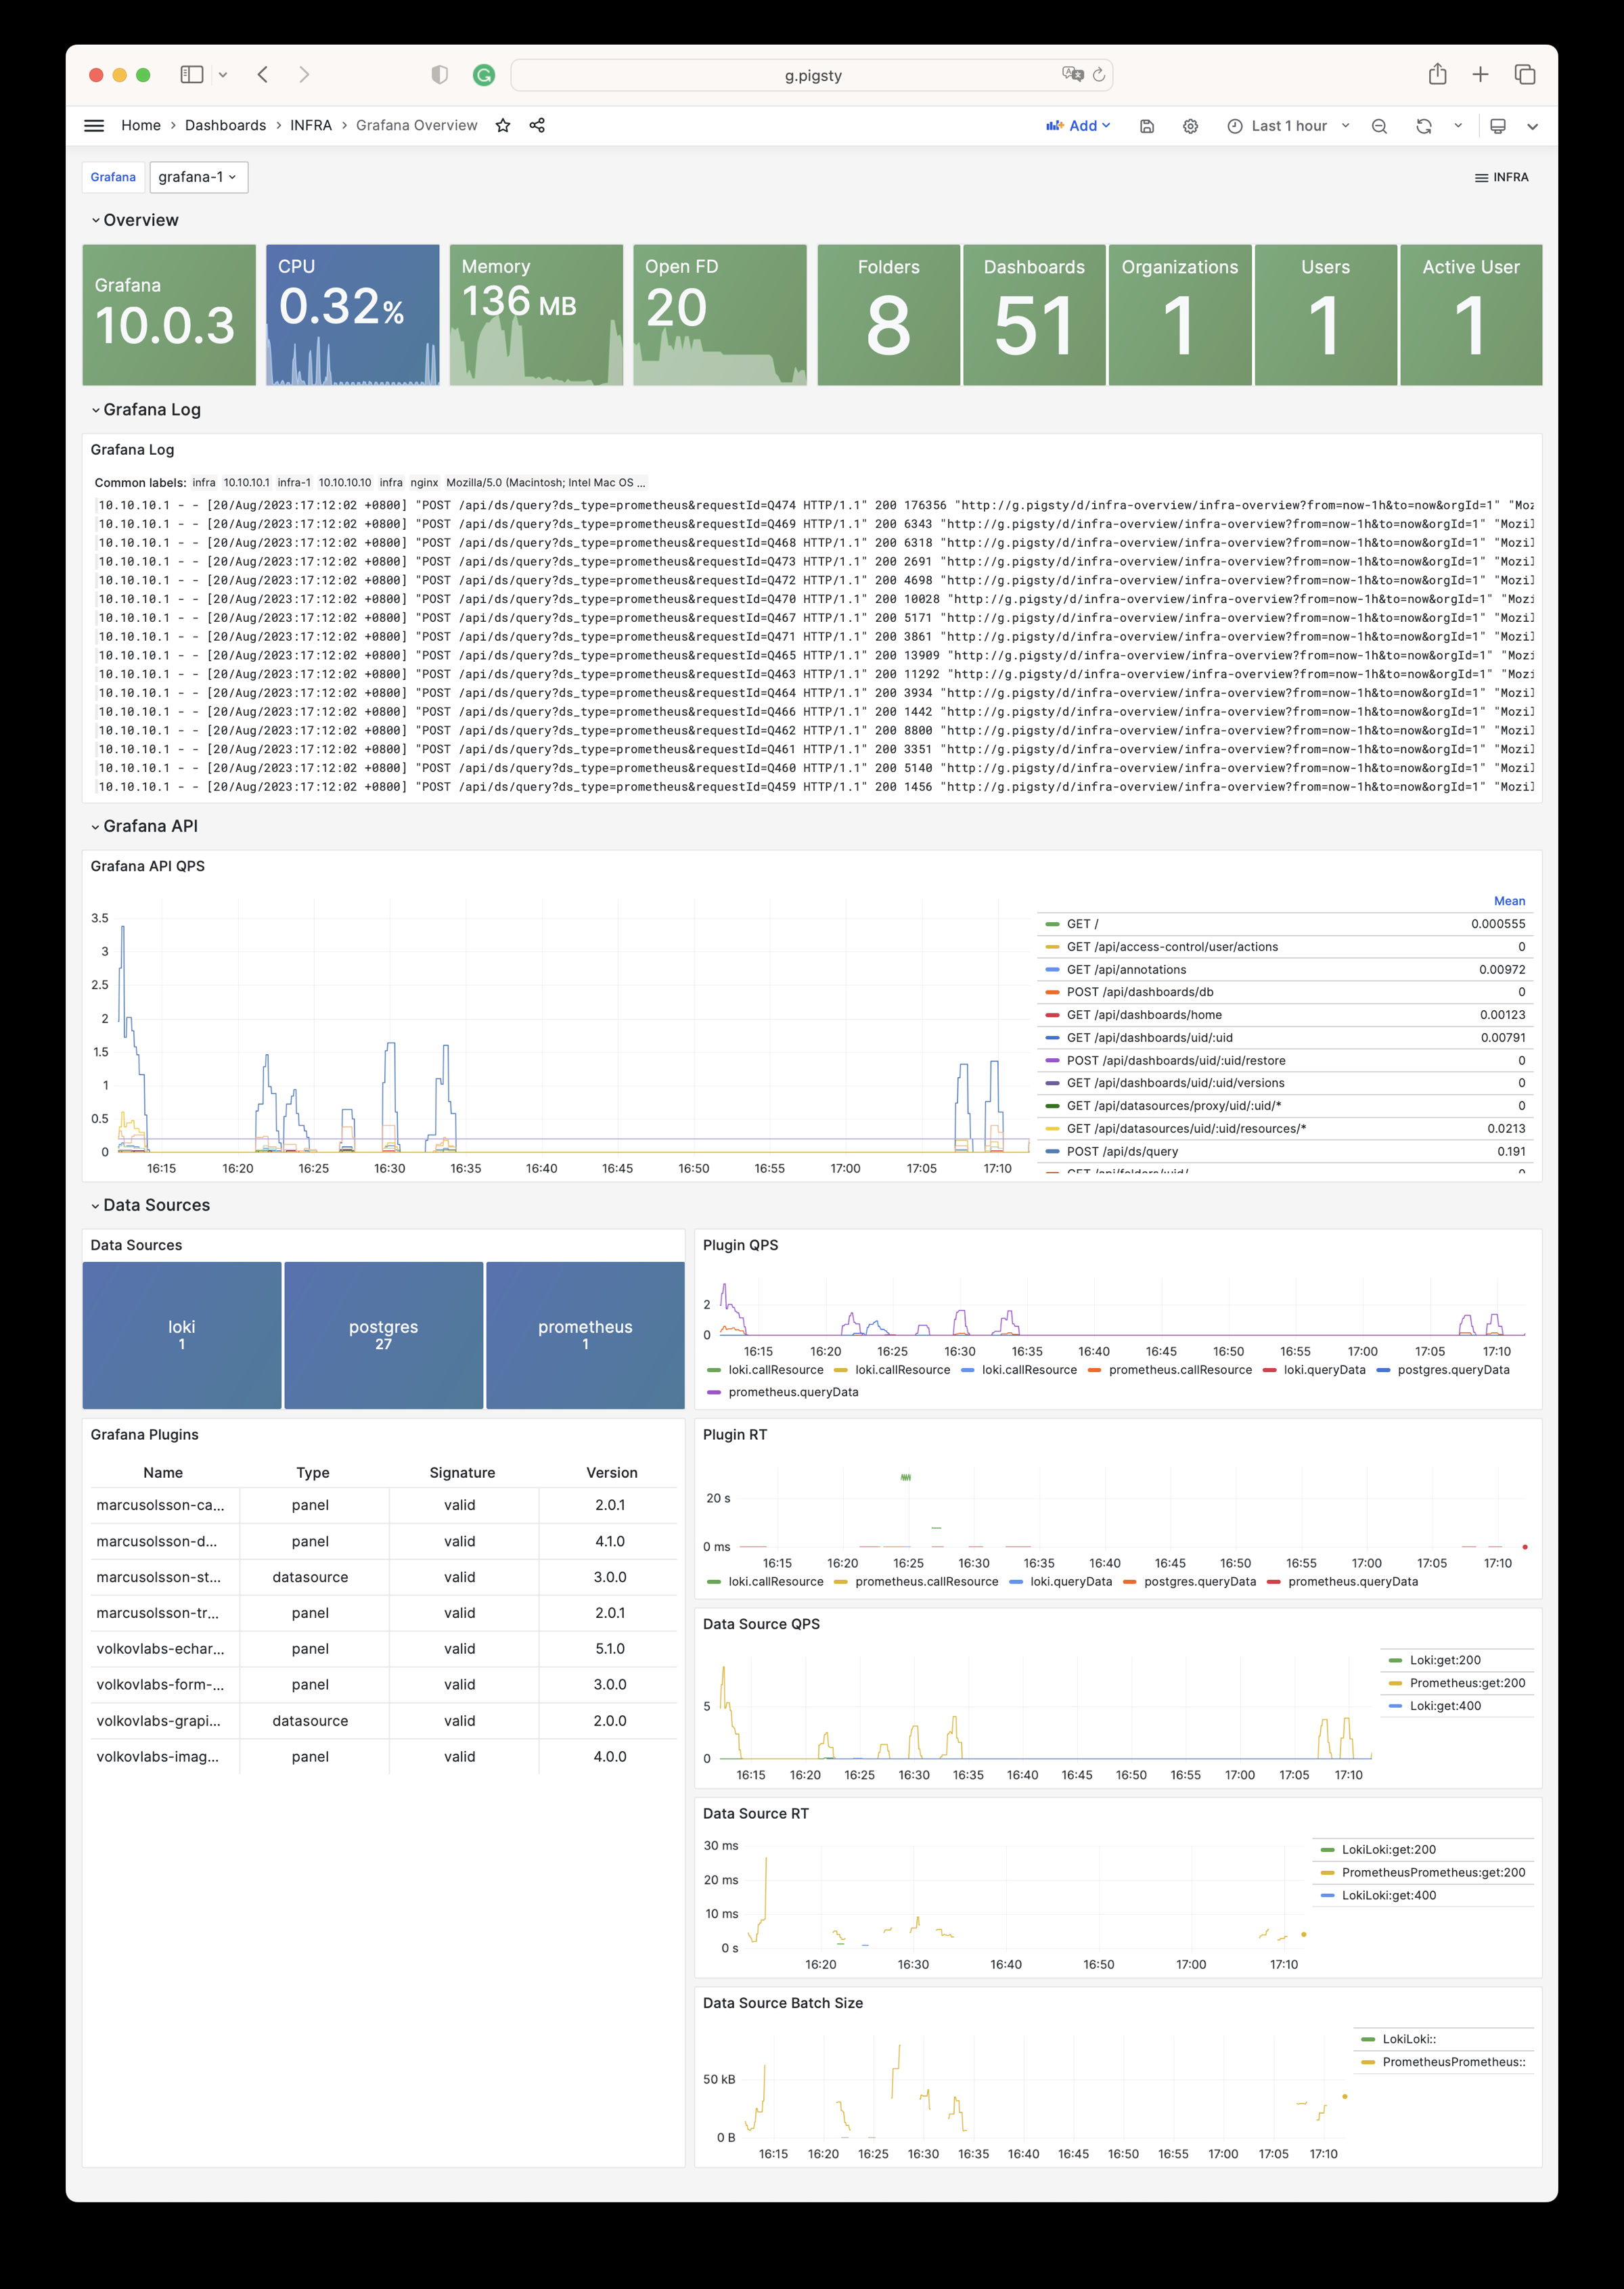
Grafana Overview
Grafana 监控指标与日志
Grafana Overview Dashboard
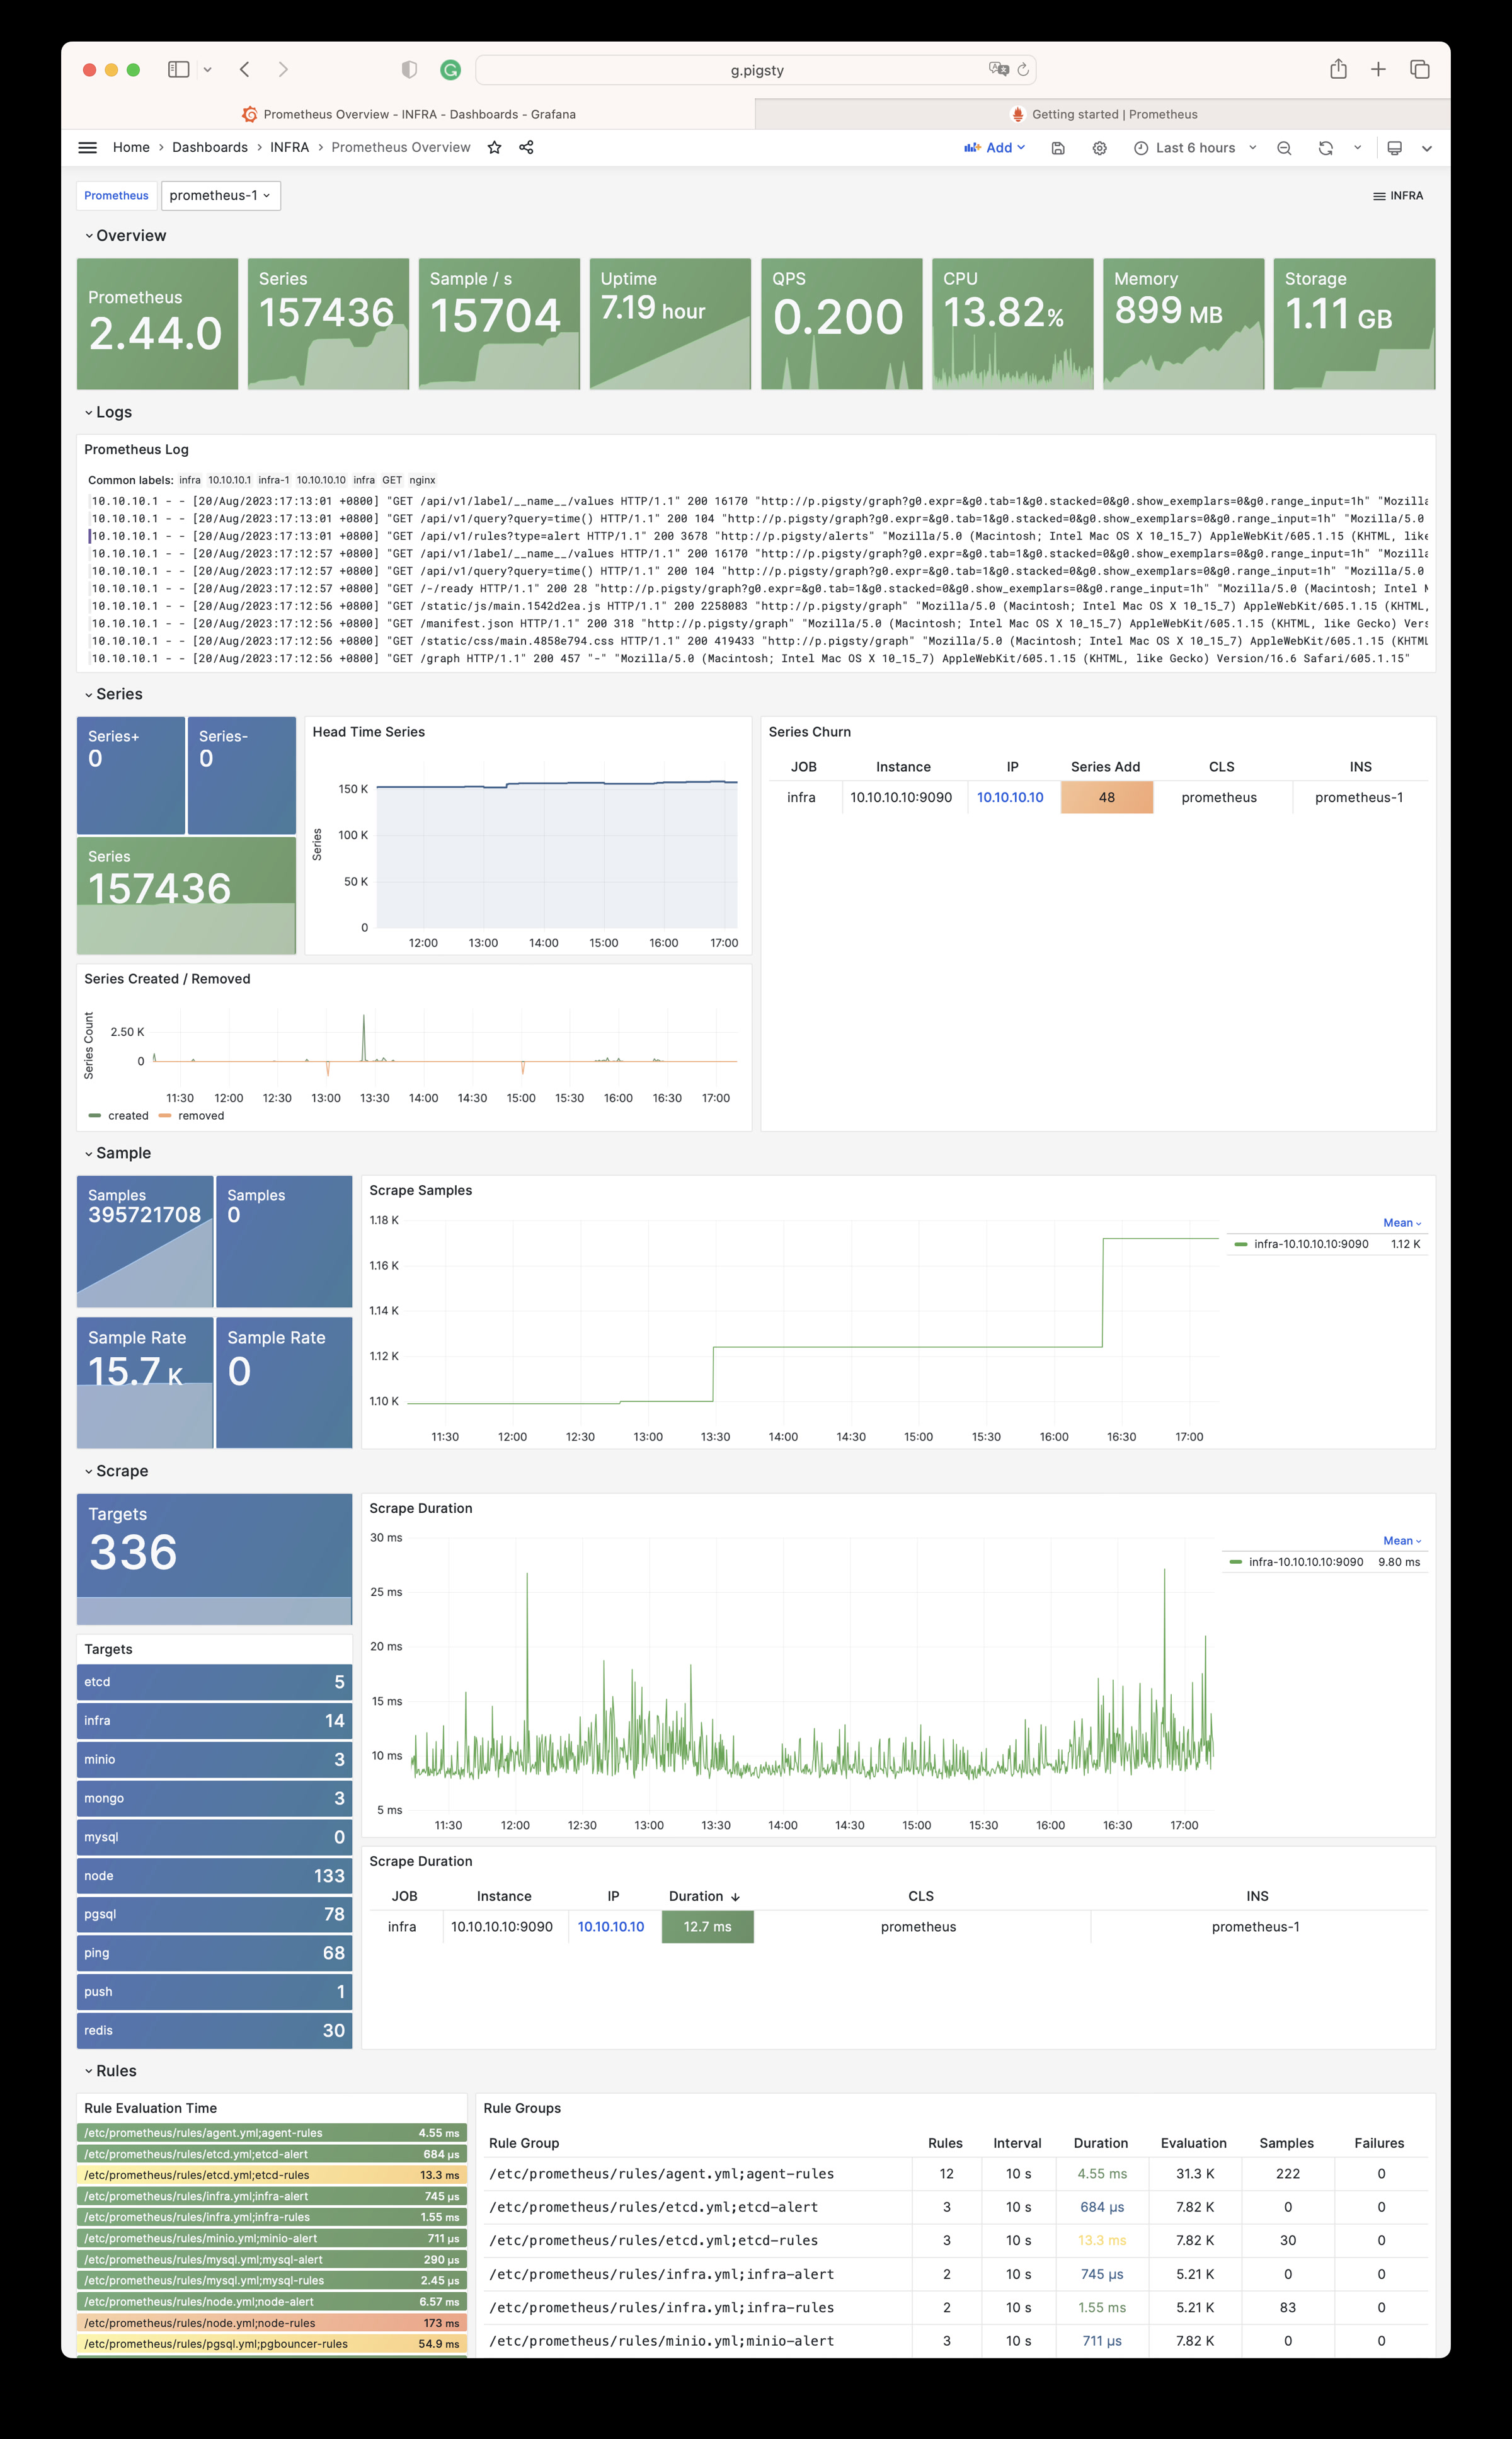
Prometheus Overview
Prometheus 监控指标与日志
Prometheus Overview Dashboard
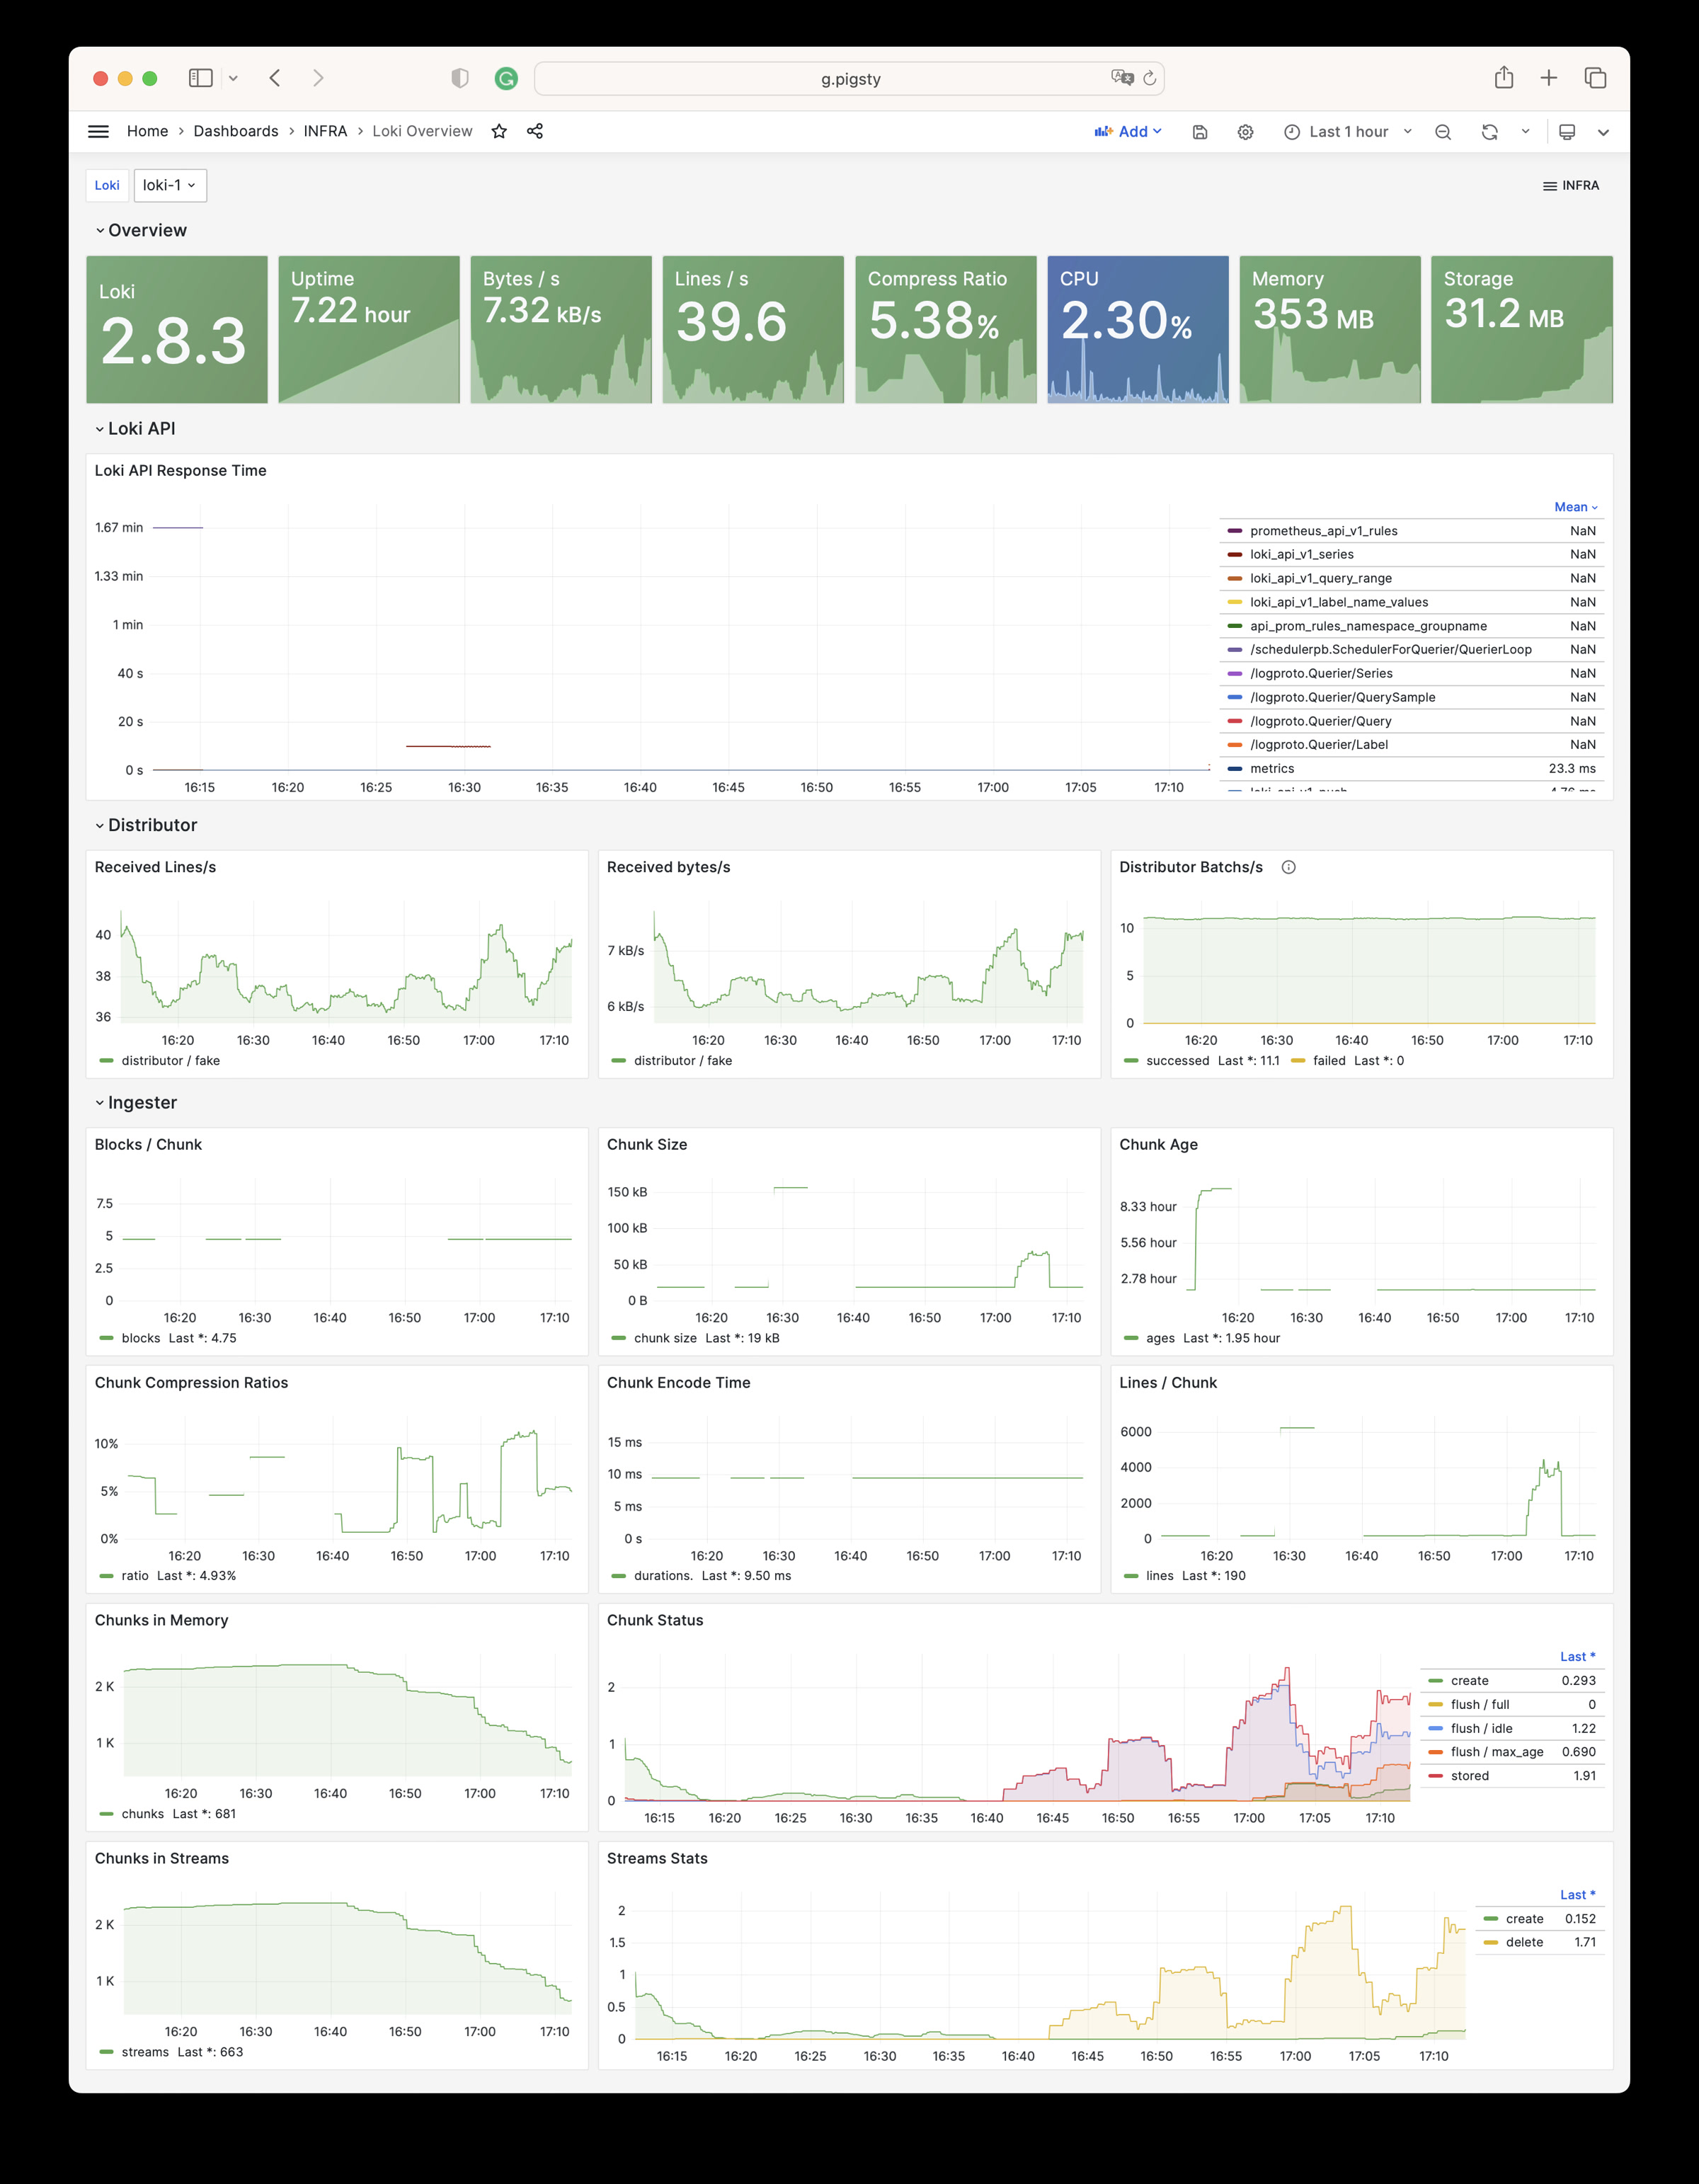
Loki Overview
Loki 监控指标与日志
Loki Overview Dashboard
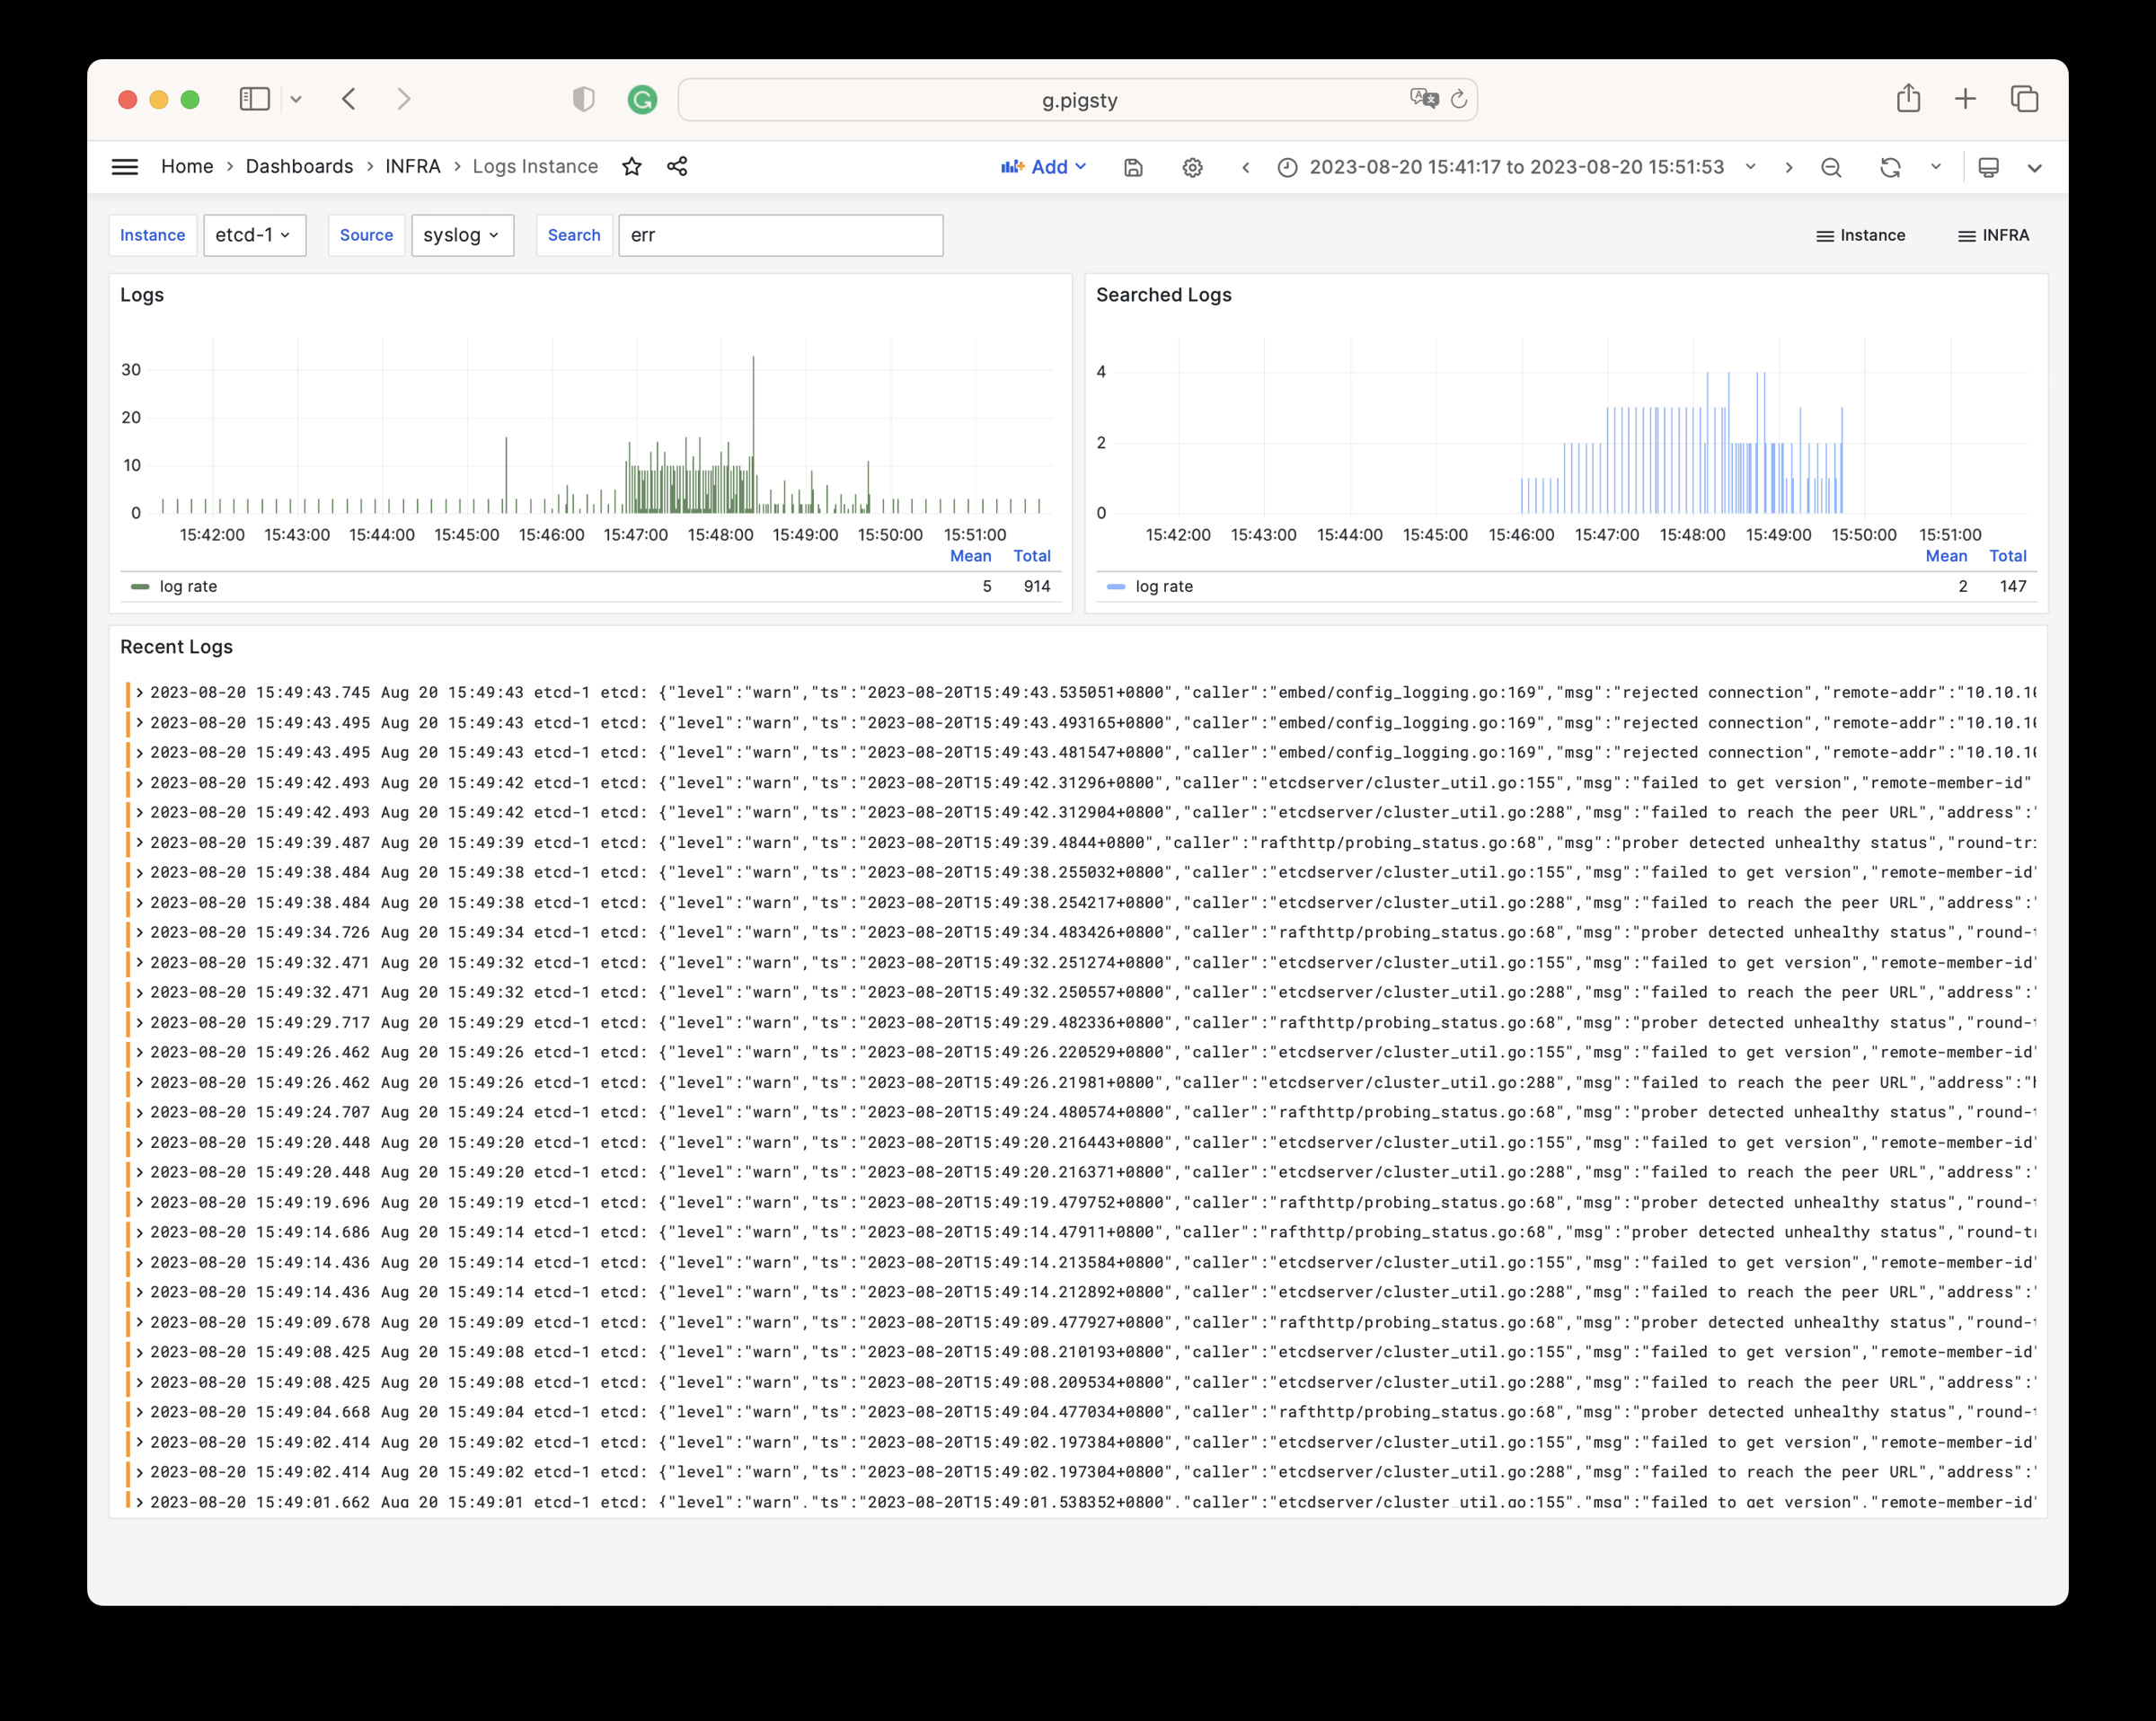
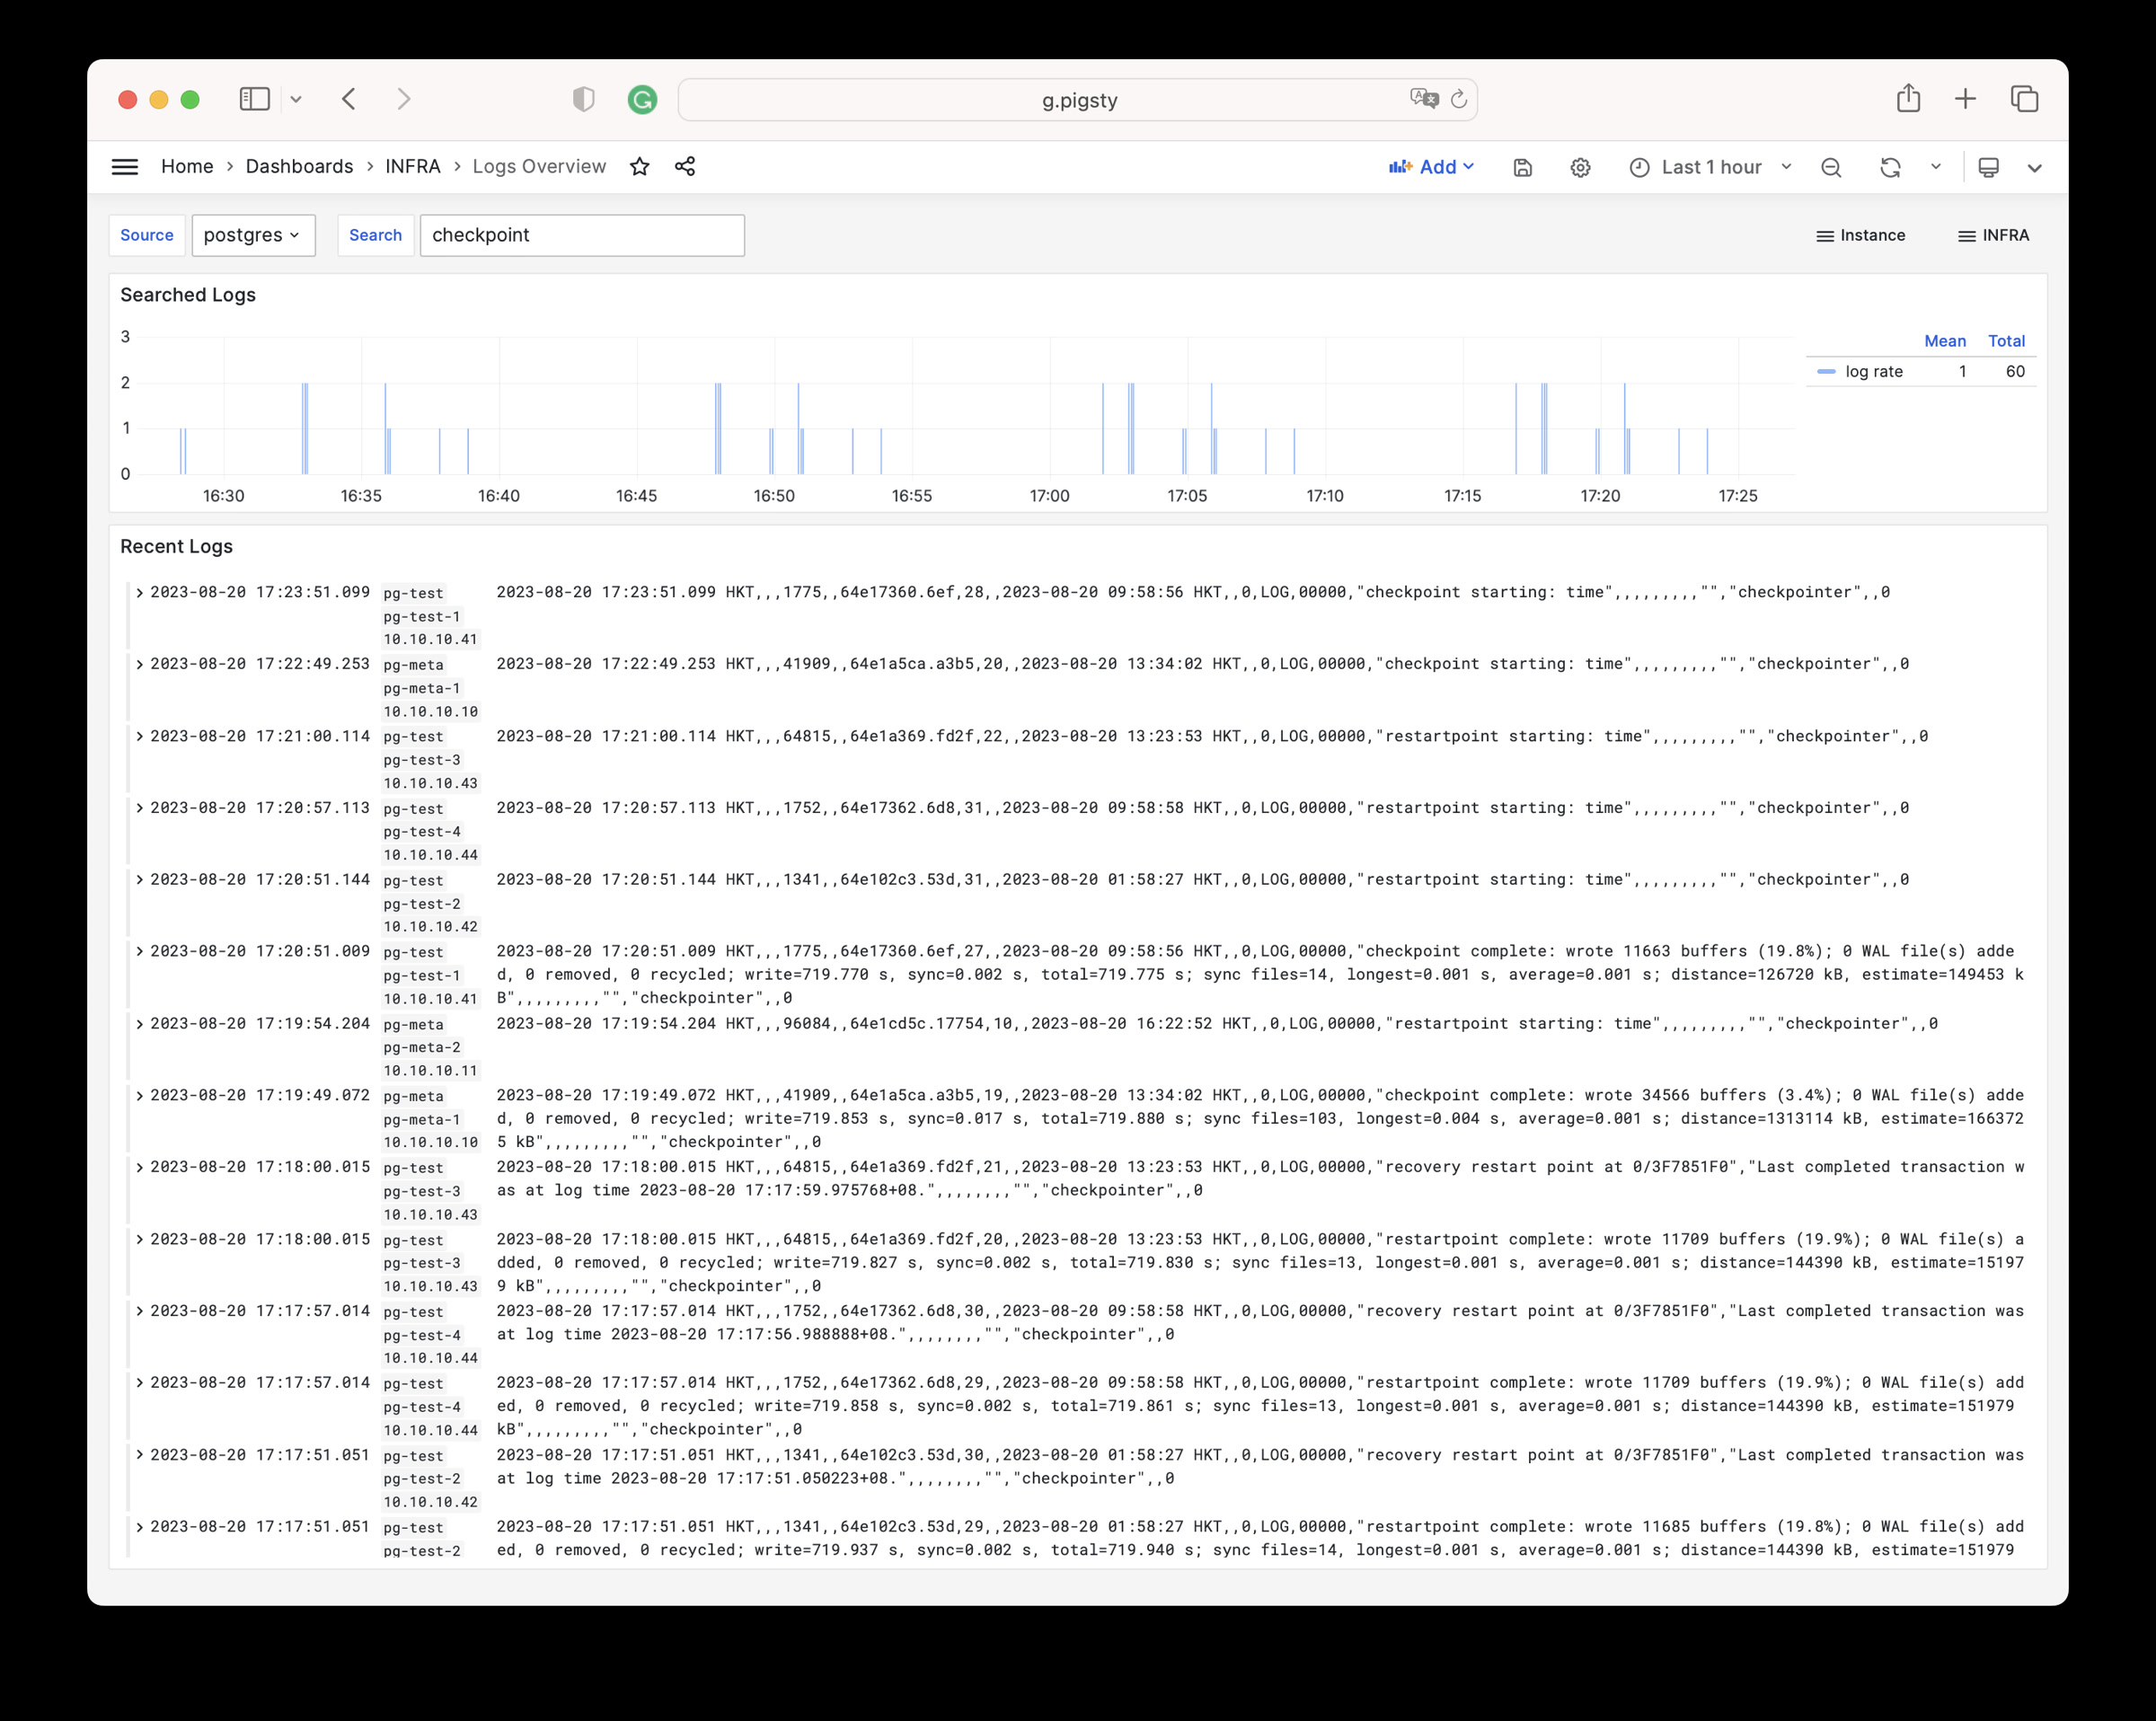
Logs Instance
查阅单个节点上的日志信息
Logs Instance Dashboard
Logs Overview
查阅全局日志信息
Logs Overview Dashboard
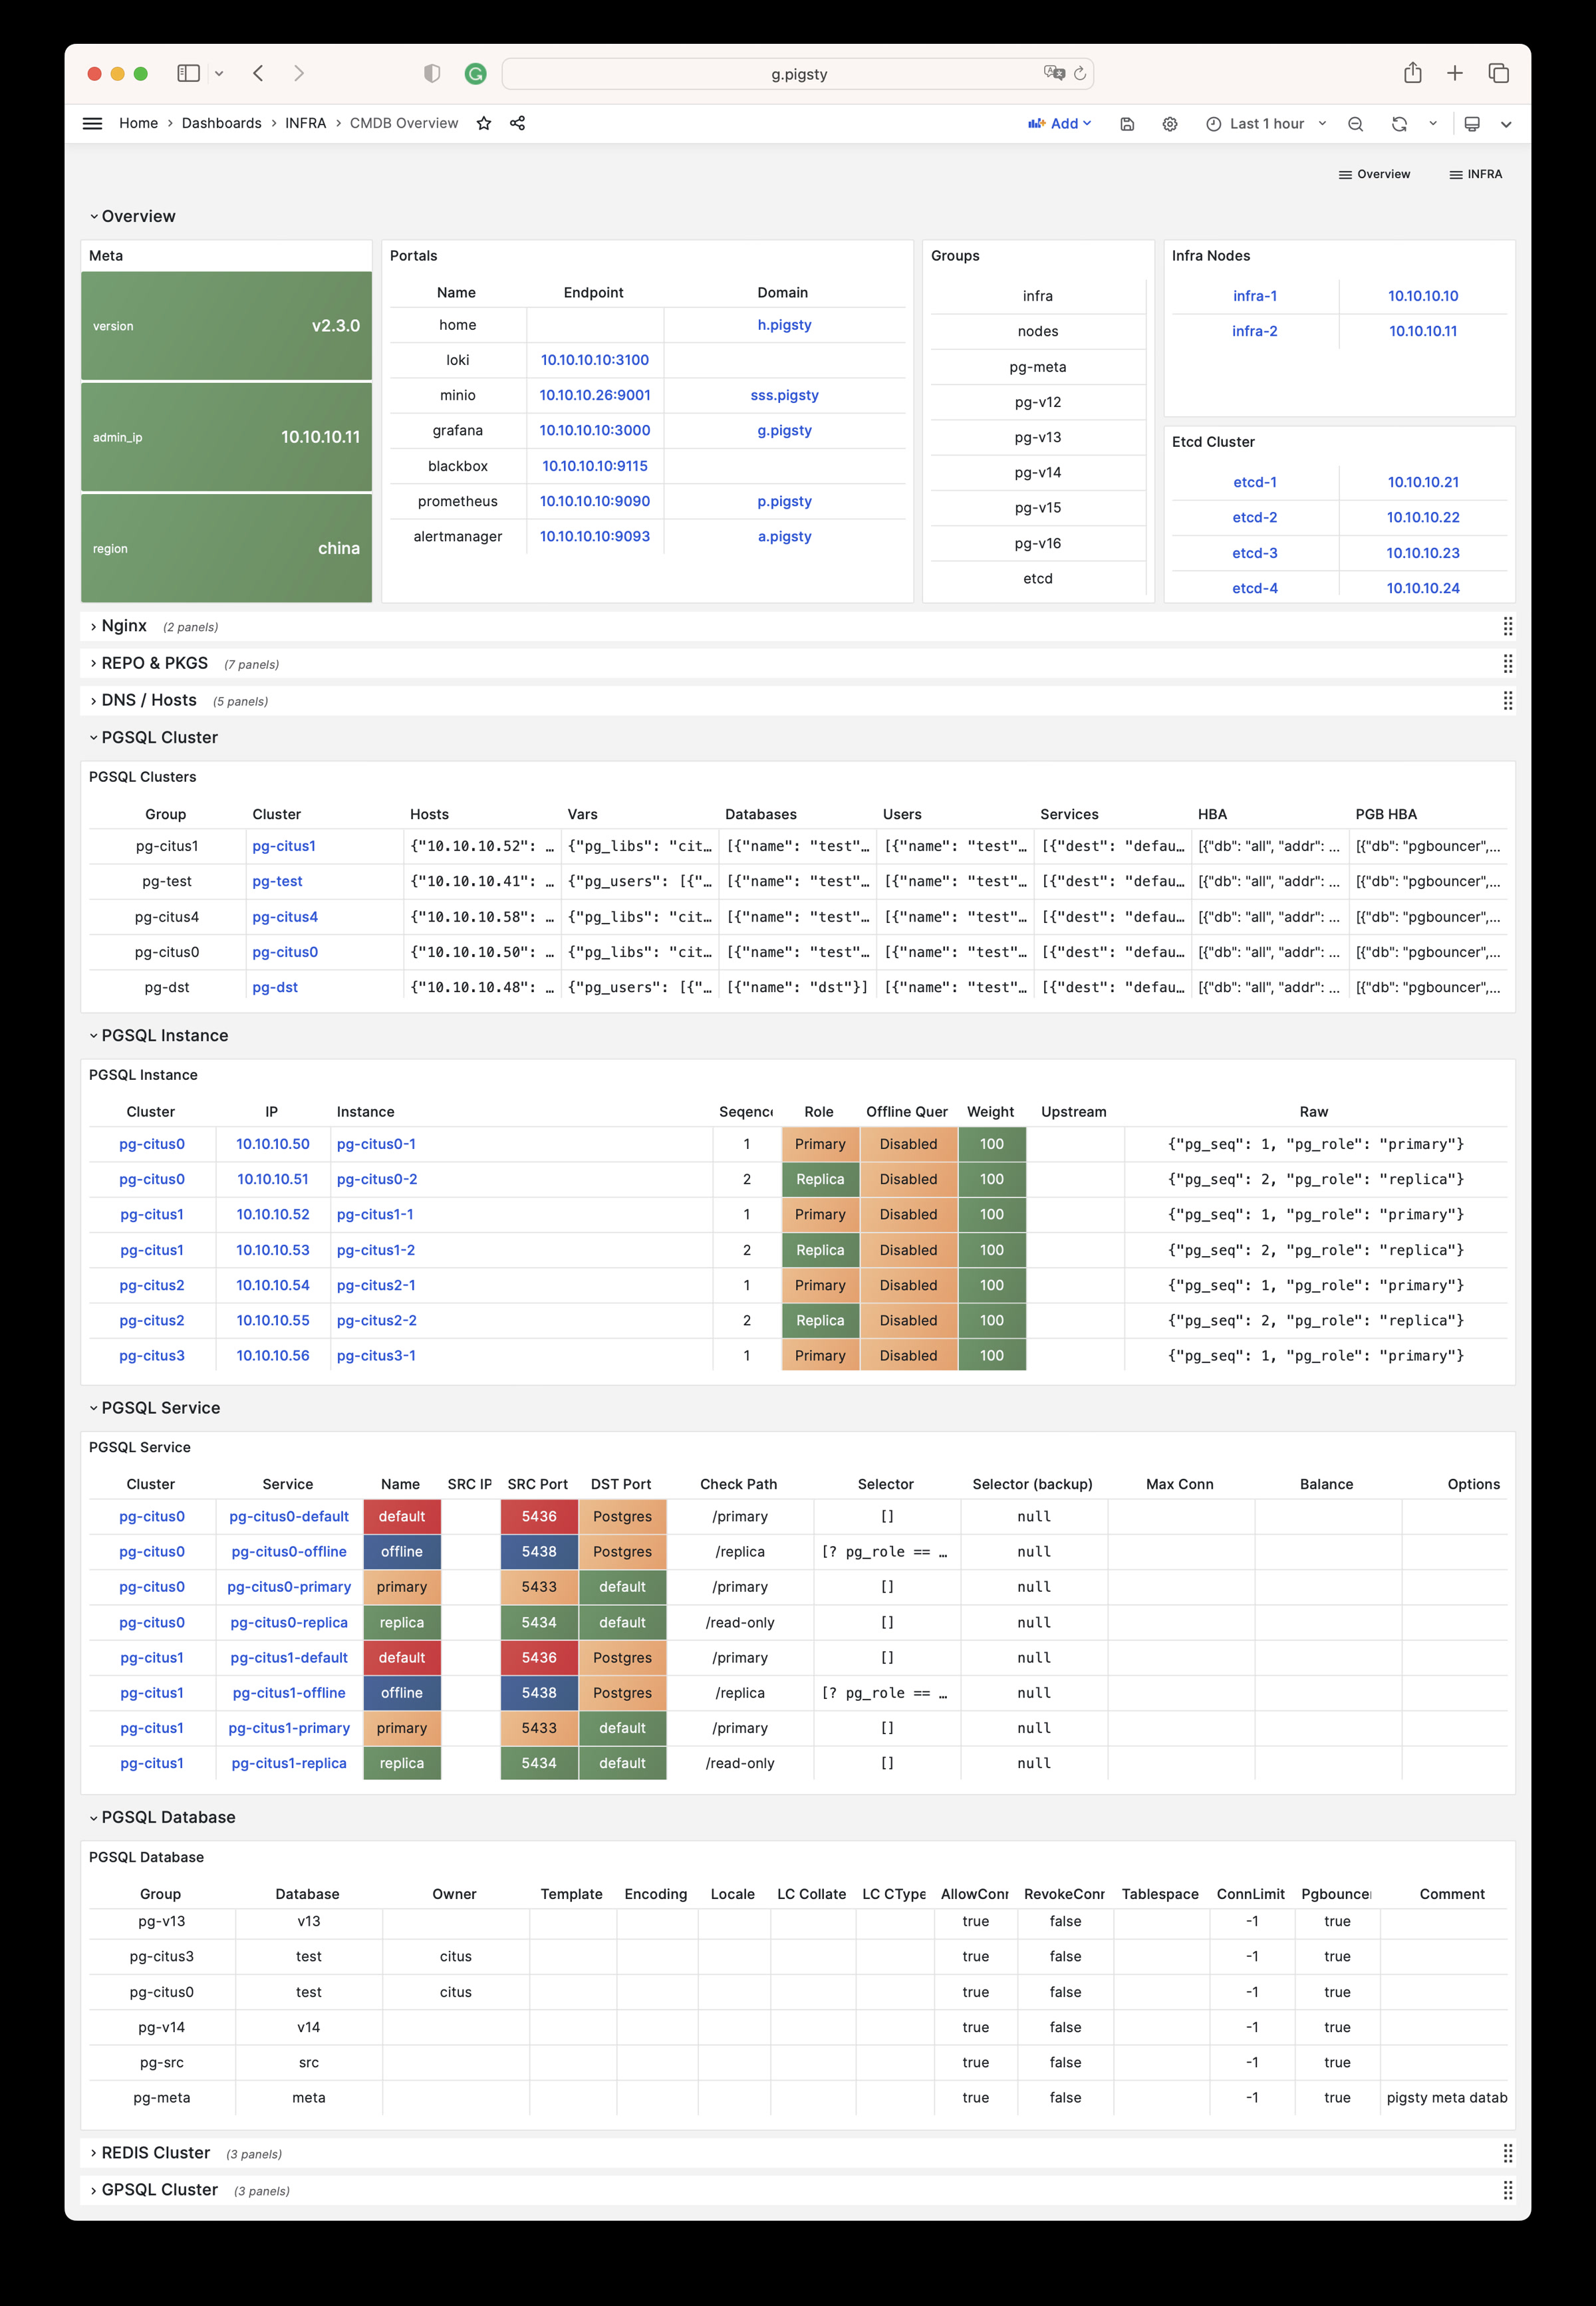
CMDB Overview
CMDB 可视化
CMDB Overview Dashboard
告警规则
Pigsty 针对 INFRA 模块提供了以下两条告警规则:
InfraDown: 基础设施组件出现宕机AgentDown: 监控Agent代理出现宕机
您可以按需在 files/prometheus/rules/infra.yml 中修改或添加新的基础设施告警规则。
################################################################
#                Infrastructure Alert Rules                    #
################################################################
- name: infra-alert
  rules:

    #==============================================================#
    #                       Infra Aliveness                        #
    #==============================================================#
    # infra components (prometheus,grafana) down for 1m triggers a P1 alert
    - alert: InfraDown
      expr: infra_up < 1
      for: 1m
      labels: { level: 0, severity: CRIT, category: infra }
      annotations:
        summary: "CRIT InfraDown {{ $labels.type }}@{{ $labels.instance }}"
        description: |
          infra_up[type={{ $labels.type }}, instance={{ $labels.instance }}] = {{ $value  | printf "%.2f" }} < 1

    #==============================================================#
    #                       Agent Aliveness                        #
    #==============================================================#

    # agent aliveness are determined directly by exporter aliveness
    # including: node_exporter, pg_exporter, pgbouncer_exporter, haproxy_exporter
    - alert: AgentDown
      expr: agent_up < 1
      for: 1m
      labels: { level: 0, severity: CRIT, category: infra }
      annotations:
        summary: 'CRIT AgentDown {{ $labels.ins }}@{{ $labels.instance }}'
        description: |
          agent_up[ins={{ $labels.ins }}, instance={{ $labels.instance }}] = {{ $value  | printf "%.2f" }} < 1
7 - 指标列表
INFRA 指标
INFRA 模块包含有 964 类可用监控指标。
| Metric Name | Type | Labels | Description |
|---|---|---|---|
| alertmanager_alerts | gauge | ins, instance, ip, job, cls, state |
How many alerts by state. |
| alertmanager_alerts_invalid_total | counter | version, ins, instance, ip, job, cls |
The total number of received alerts that were invalid. |
| alertmanager_alerts_received_total | counter | version, ins, instance, ip, status, job, cls |
The total number of received alerts. |
| alertmanager_build_info | gauge | revision, version, ins, instance, ip, tags, goarch, goversion, job, cls, branch, goos |
A metric with a constant ‘1’ value labeled by version, revision, branch, goversion from which alertmanager was built, and the goos and goarch for the build. |
| alertmanager_cluster_alive_messages_total | counter | ins, instance, ip, peer, job, cls |
Total number of received alive messages. |
| alertmanager_cluster_enabled | gauge | ins, instance, ip, job, cls |
Indicates whether the clustering is enabled or not. |
| alertmanager_cluster_failed_peers | gauge | ins, instance, ip, job, cls |
Number indicating the current number of failed peers in the cluster. |
| alertmanager_cluster_health_score | gauge | ins, instance, ip, job, cls |
Health score of the cluster. Lower values are better and zero means ’totally healthy’. |
| alertmanager_cluster_members | gauge | ins, instance, ip, job, cls |
Number indicating current number of members in cluster. |
| alertmanager_cluster_messages_pruned_total | counter | ins, instance, ip, job, cls |
Total number of cluster messages pruned. |
| alertmanager_cluster_messages_queued | gauge | ins, instance, ip, job, cls |
Number of cluster messages which are queued. |
| alertmanager_cluster_messages_received_size_total | counter | ins, instance, ip, msg_type, job, cls |
Total size of cluster messages received. |
| alertmanager_cluster_messages_received_total | counter | ins, instance, ip, msg_type, job, cls |
Total number of cluster messages received. |
| alertmanager_cluster_messages_sent_size_total | counter | ins, instance, ip, msg_type, job, cls |
Total size of cluster messages sent. |
| alertmanager_cluster_messages_sent_total | counter | ins, instance, ip, msg_type, job, cls |
Total number of cluster messages sent. |
| alertmanager_cluster_peer_info | gauge | ins, instance, ip, peer, job, cls |
A metric with a constant ‘1’ value labeled by peer name. |
| alertmanager_cluster_peers_joined_total | counter | ins, instance, ip, job, cls |
A counter of the number of peers that have joined. |
| alertmanager_cluster_peers_left_total | counter | ins, instance, ip, job, cls |
A counter of the number of peers that have left. |
| alertmanager_cluster_peers_update_total | counter | ins, instance, ip, job, cls |
A counter of the number of peers that have updated metadata. |
| alertmanager_cluster_reconnections_failed_total | counter | ins, instance, ip, job, cls |
A counter of the number of failed cluster peer reconnection attempts. |
| alertmanager_cluster_reconnections_total | counter | ins, instance, ip, job, cls |
A counter of the number of cluster peer reconnections. |
| alertmanager_cluster_refresh_join_failed_total | counter | ins, instance, ip, job, cls |
A counter of the number of failed cluster peer joined attempts via refresh. |
| alertmanager_cluster_refresh_join_total | counter | ins, instance, ip, job, cls |
A counter of the number of cluster peer joined via refresh. |
| alertmanager_config_hash | gauge | ins, instance, ip, job, cls |
Hash of the currently loaded alertmanager configuration. |
| alertmanager_config_last_reload_success_timestamp_seconds | gauge | ins, instance, ip, job, cls |
Timestamp of the last successful configuration reload. |
| alertmanager_config_last_reload_successful | gauge | ins, instance, ip, job, cls |
Whether the last configuration reload attempt was successful. |
| alertmanager_dispatcher_aggregation_groups | gauge | ins, instance, ip, job, cls |
Number of active aggregation groups |
| alertmanager_dispatcher_alert_processing_duration_seconds_count | Unknown | ins, instance, ip, job, cls |
N/A |
| alertmanager_dispatcher_alert_processing_duration_seconds_sum | Unknown | ins, instance, ip, job, cls |
N/A |
| alertmanager_http_concurrency_limit_exceeded_total | counter | ins, instance, method, ip, job, cls |
Total number of times an HTTP request failed because the concurrency limit was reached. |
| alertmanager_http_request_duration_seconds_bucket | Unknown | ins, instance, method, ip, le, job, cls, handler |
N/A |
| alertmanager_http_request_duration_seconds_count | Unknown | ins, instance, method, ip, job, cls, handler |
N/A |
| alertmanager_http_request_duration_seconds_sum | Unknown | ins, instance, method, ip, job, cls, handler |
N/A |
| alertmanager_http_requests_in_flight | gauge | ins, instance, method, ip, job, cls |
Current number of HTTP requests being processed. |
| alertmanager_http_response_size_bytes_bucket | Unknown | ins, instance, method, ip, le, job, cls, handler |
N/A |
| alertmanager_http_response_size_bytes_count | Unknown | ins, instance, method, ip, job, cls, handler |
N/A |
| alertmanager_http_response_size_bytes_sum | Unknown | ins, instance, method, ip, job, cls, handler |
N/A |
| alertmanager_integrations | gauge | ins, instance, ip, job, cls |
Number of configured integrations. |
| alertmanager_marked_alerts | gauge | ins, instance, ip, job, cls, state |
How many alerts by state are currently marked in the Alertmanager regardless of their expiry. |
| alertmanager_nflog_gc_duration_seconds_count | Unknown | ins, instance, ip, job, cls |
N/A |
| alertmanager_nflog_gc_duration_seconds_sum | Unknown | ins, instance, ip, job, cls |
N/A |
| alertmanager_nflog_gossip_messages_propagated_total | counter | ins, instance, ip, job, cls |
Number of received gossip messages that have been further gossiped. |
| alertmanager_nflog_maintenance_errors_total | counter | ins, instance, ip, job, cls |
How many maintenances were executed for the notification log that failed. |
| alertmanager_nflog_maintenance_total | counter | ins, instance, ip, job, cls |
How many maintenances were executed for the notification log. |
| alertmanager_nflog_queries_total | counter | ins, instance, ip, job, cls |
Number of notification log queries were received. |
| alertmanager_nflog_query_duration_seconds_bucket | Unknown | ins, instance, ip, le, job, cls |
N/A |
| alertmanager_nflog_query_duration_seconds_count | Unknown | ins, instance, ip, job, cls |
N/A |
| alertmanager_nflog_query_duration_seconds_sum | Unknown | ins, instance, ip, job, cls |
N/A |
| alertmanager_nflog_query_errors_total | counter | ins, instance, ip, job, cls |
Number notification log received queries that failed. |
| alertmanager_nflog_snapshot_duration_seconds_count | Unknown | ins, instance, ip, job, cls |
N/A |
| alertmanager_nflog_snapshot_duration_seconds_sum | Unknown | ins, instance, ip, job, cls |
N/A |
| alertmanager_nflog_snapshot_size_bytes | gauge | ins, instance, ip, job, cls |
Size of the last notification log snapshot in bytes. |
| alertmanager_notification_latency_seconds_bucket | Unknown | integration, ins, instance, ip, le, job, cls |
N/A |
| alertmanager_notification_latency_seconds_count | Unknown | integration, ins, instance, ip, job, cls |
N/A |
| alertmanager_notification_latency_seconds_sum | Unknown | integration, ins, instance, ip, job, cls |
N/A |
| alertmanager_notification_requests_failed_total | counter | integration, ins, instance, ip, job, cls |
The total number of failed notification requests. |
| alertmanager_notification_requests_total | counter | integration, ins, instance, ip, job, cls |
The total number of attempted notification requests. |
| alertmanager_notifications_failed_total | counter | integration, ins, instance, ip, reason, job, cls |
The total number of failed notifications. |
| alertmanager_notifications_total | counter | integration, ins, instance, ip, job, cls |
The total number of attempted notifications. |
| alertmanager_oversize_gossip_message_duration_seconds_bucket | Unknown | ins, instance, ip, le, key, job, cls |
N/A |
| alertmanager_oversize_gossip_message_duration_seconds_count | Unknown | ins, instance, ip, key, job, cls |
N/A |
| alertmanager_oversize_gossip_message_duration_seconds_sum | Unknown | ins, instance, ip, key, job, cls |
N/A |
| alertmanager_oversized_gossip_message_dropped_total | counter | ins, instance, ip, key, job, cls |
Number of oversized gossip messages that were dropped due to a full message queue. |
| alertmanager_oversized_gossip_message_failure_total | counter | ins, instance, ip, key, job, cls |
Number of oversized gossip message sends that failed. |
| alertmanager_oversized_gossip_message_sent_total | counter | ins, instance, ip, key, job, cls |
Number of oversized gossip message sent. |
| alertmanager_peer_position | gauge | ins, instance, ip, job, cls |
Position the Alertmanager instance believes it’s in. The position determines a peer’s behavior in the cluster. |
| alertmanager_receivers | gauge | ins, instance, ip, job, cls |
Number of configured receivers. |
| alertmanager_silences | gauge | ins, instance, ip, job, cls, state |
How many silences by state. |
| alertmanager_silences_gc_duration_seconds_count | Unknown | ins, instance, ip, job, cls |
N/A |
| alertmanager_silences_gc_duration_seconds_sum | Unknown | ins, instance, ip, job, cls |
N/A |
| alertmanager_silences_gossip_messages_propagated_total | counter | ins, instance, ip, job, cls |
Number of received gossip messages that have been further gossiped. |
| alertmanager_silences_maintenance_errors_total | counter | ins, instance, ip, job, cls |
How many maintenances were executed for silences that failed. |
| alertmanager_silences_maintenance_total | counter | ins, instance, ip, job, cls |
How many maintenances were executed for silences. |
| alertmanager_silences_queries_total | counter | ins, instance, ip, job, cls |
How many silence queries were received. |
| alertmanager_silences_query_duration_seconds_bucket | Unknown | ins, instance, ip, le, job, cls |
N/A |
| alertmanager_silences_query_duration_seconds_count | Unknown | ins, instance, ip, job, cls |
N/A |
| alertmanager_silences_query_duration_seconds_sum | Unknown | ins, instance, ip, job, cls |
N/A |
| alertmanager_silences_query_errors_total | counter | ins, instance, ip, job, cls |
How many silence received queries did not succeed. |
| alertmanager_silences_snapshot_duration_seconds_count | Unknown | ins, instance, ip, job, cls |
N/A |
| alertmanager_silences_snapshot_duration_seconds_sum | Unknown | ins, instance, ip, job, cls |
N/A |
| alertmanager_silences_snapshot_size_bytes | gauge | ins, instance, ip, job, cls |
Size of the last silence snapshot in bytes. |
| blackbox_exporter_build_info | gauge | revision, version, ins, instance, ip, tags, goarch, goversion, job, cls, branch, goos |
A metric with a constant ‘1’ value labeled by version, revision, branch, goversion from which blackbox_exporter was built, and the goos and goarch for the build. |
| blackbox_exporter_config_last_reload_success_timestamp_seconds | gauge | ins, instance, ip, job, cls |
Timestamp of the last successful configuration reload. |
| blackbox_exporter_config_last_reload_successful | gauge | ins, instance, ip, job, cls |
Blackbox exporter config loaded successfully. |
| blackbox_module_unknown_total | counter | ins, instance, ip, job, cls |
Count of unknown modules requested by probes |
| cortex_distributor_ingester_clients | gauge | ins, instance, ip, job, cls |
The current number of ingester clients. |
| cortex_dns_failures_total | Unknown | ins, instance, ip, job, cls |
N/A |
| cortex_dns_lookups_total | Unknown | ins, instance, ip, job, cls |
N/A |
| cortex_frontend_query_range_duration_seconds_bucket | Unknown | ins, instance, method, ip, le, job, cls, status_code |
N/A |
| cortex_frontend_query_range_duration_seconds_count | Unknown | ins, instance, method, ip, job, cls, status_code |
N/A |
| cortex_frontend_query_range_duration_seconds_sum | Unknown | ins, instance, method, ip, job, cls, status_code |
N/A |
| cortex_ingester_flush_queue_length | gauge | ins, instance, ip, job, cls |
The total number of series pending in the flush queue. |
| cortex_kv_request_duration_seconds_bucket | Unknown | ins, instance, role, ip, le, kv_name, type, operation, job, cls, status_code |
N/A |
| cortex_kv_request_duration_seconds_count | Unknown | ins, instance, role, ip, kv_name, type, operation, job, cls, status_code |
N/A |
| cortex_kv_request_duration_seconds_sum | Unknown | ins, instance, role, ip, kv_name, type, operation, job, cls, status_code |
N/A |
| cortex_member_consul_heartbeats_total | Unknown | ins, instance, ip, job, cls |
N/A |
| cortex_prometheus_notifications_alertmanagers_discovered | gauge | ins, instance, ip, user, job, cls |
The number of alertmanagers discovered and active. |
| cortex_prometheus_notifications_dropped_total | Unknown | ins, instance, ip, user, job, cls |
N/A |
| cortex_prometheus_notifications_queue_capacity | gauge | ins, instance, ip, user, job, cls |
The capacity of the alert notifications queue. |
| cortex_prometheus_notifications_queue_length | gauge | ins, instance, ip, user, job, cls |
The number of alert notifications in the queue. |
| cortex_prometheus_rule_evaluation_duration_seconds | summary | ins, instance, ip, user, job, cls, quantile |
The duration for a rule to execute. |
| cortex_prometheus_rule_evaluation_duration_seconds_count | Unknown | ins, instance, ip, user, job, cls |
N/A |
| cortex_prometheus_rule_evaluation_duration_seconds_sum | Unknown | ins, instance, ip, user, job, cls |
N/A |
| cortex_prometheus_rule_group_duration_seconds | summary | ins, instance, ip, user, job, cls, quantile |
The duration of rule group evaluations. |
| cortex_prometheus_rule_group_duration_seconds_count | Unknown | ins, instance, ip, user, job, cls |
N/A |
| cortex_prometheus_rule_group_duration_seconds_sum | Unknown | ins, instance, ip, user, job, cls |
N/A |
| cortex_query_frontend_connected_schedulers | gauge | ins, instance, ip, job, cls |
Number of schedulers this frontend is connected to. |
| cortex_query_frontend_queries_in_progress | gauge | ins, instance, ip, job, cls |
Number of queries in progress handled by this frontend. |
| cortex_query_frontend_retries_bucket | Unknown | ins, instance, ip, le, job, cls |
N/A |
| cortex_query_frontend_retries_count | Unknown | ins, instance, ip, job, cls |
N/A |
| cortex_query_frontend_retries_sum | Unknown | ins, instance, ip, job, cls |
N/A |
| cortex_query_scheduler_connected_frontend_clients | gauge | ins, instance, ip, job, cls |
Number of query-frontend worker clients currently connected to the query-scheduler. |
| cortex_query_scheduler_connected_querier_clients | gauge | ins, instance, ip, job, cls |
Number of querier worker clients currently connected to the query-scheduler. |
| cortex_query_scheduler_inflight_requests | summary | ins, instance, ip, job, cls, quantile |
Number of inflight requests (either queued or processing) sampled at a regular interval. Quantile buckets keep track of inflight requests over the last 60s. |
| cortex_query_scheduler_inflight_requests_count | Unknown | ins, instance, ip, job, cls |
N/A |
| cortex_query_scheduler_inflight_requests_sum | Unknown | ins, instance, ip, job, cls |
N/A |
| cortex_query_scheduler_queue_duration_seconds_bucket | Unknown | ins, instance, ip, le, job, cls |
N/A |
| cortex_query_scheduler_queue_duration_seconds_count | Unknown | ins, instance, ip, job, cls |
N/A |
| cortex_query_scheduler_queue_duration_seconds_sum | Unknown | ins, instance, ip, job, cls |
N/A |
| cortex_query_scheduler_queue_length | Unknown | ins, instance, ip, user, job, cls |
N/A |
| cortex_query_scheduler_running | gauge | ins, instance, ip, job, cls |
Value will be 1 if the scheduler is in the ReplicationSet and actively receiving/processing requests |
| cortex_ring_member_heartbeats_total | Unknown | ins, instance, ip, job, cls |
N/A |
| cortex_ring_member_tokens_owned | gauge | ins, instance, ip, job, cls |
The number of tokens owned in the ring. |
| cortex_ring_member_tokens_to_own | gauge | ins, instance, ip, job, cls |
The number of tokens to own in the ring. |
| cortex_ring_members | gauge | ins, instance, ip, job, cls, state |
Number of members in the ring |
| cortex_ring_oldest_member_timestamp | gauge | ins, instance, ip, job, cls, state |
Timestamp of the oldest member in the ring. |
| cortex_ring_tokens_total | gauge | ins, instance, ip, job, cls |
Number of tokens in the ring |
| cortex_ruler_clients | gauge | ins, instance, ip, job, cls |
The current number of ruler clients in the pool. |
| cortex_ruler_config_last_reload_successful | gauge | ins, instance, ip, user, job, cls |
Boolean set to 1 whenever the last configuration reload attempt was successful. |
| cortex_ruler_config_last_reload_successful_seconds | gauge | ins, instance, ip, user, job, cls |
Timestamp of the last successful configuration reload. |
| cortex_ruler_config_updates_total | Unknown | ins, instance, ip, user, job, cls |
N/A |
| cortex_ruler_managers_total | gauge | ins, instance, ip, job, cls |
Total number of managers registered and running in the ruler |
| cortex_ruler_ring_check_errors_total | Unknown | ins, instance, ip, job, cls |
N/A |
| cortex_ruler_sync_rules_total | Unknown | ins, instance, ip, reason, job, cls |
N/A |
| deprecated_flags_inuse_total | Unknown | ins, instance, ip, job, cls |
N/A |
| go_cgo_go_to_c_calls_calls_total | Unknown | ins, instance, ip, job, cls |
N/A |
| go_cpu_classes_gc_mark_assist_cpu_seconds_total | Unknown | ins, instance, ip, job, cls |
N/A |
| go_cpu_classes_gc_mark_dedicated_cpu_seconds_total | Unknown | ins, instance, ip, job, cls |
N/A |
| go_cpu_classes_gc_mark_idle_cpu_seconds_total | Unknown | ins, instance, ip, job, cls |
N/A |
| go_cpu_classes_gc_pause_cpu_seconds_total | Unknown | ins, instance, ip, job, cls |
N/A |
| go_cpu_classes_gc_total_cpu_seconds_total | Unknown | ins, instance, ip, job, cls |
N/A |
| go_cpu_classes_idle_cpu_seconds_total | Unknown | ins, instance, ip, job, cls |
N/A |
| go_cpu_classes_scavenge_assist_cpu_seconds_total | Unknown | ins, instance, ip, job, cls |
N/A |
| go_cpu_classes_scavenge_background_cpu_seconds_total | Unknown | ins, instance, ip, job, cls |
N/A |
| go_cpu_classes_scavenge_total_cpu_seconds_total | Unknown | ins, instance, ip, job, cls |
N/A |
| go_cpu_classes_total_cpu_seconds_total | Unknown | ins, instance, ip, job, cls |
N/A |
| go_cpu_classes_user_cpu_seconds_total | Unknown | ins, instance, ip, job, cls |
N/A |
| go_gc_cycles_automatic_gc_cycles_total | Unknown | ins, instance, ip, job, cls |
N/A |
| go_gc_cycles_forced_gc_cycles_total | Unknown | ins, instance, ip, job, cls |
N/A |
| go_gc_cycles_total_gc_cycles_total | Unknown | ins, instance, ip, job, cls |
N/A |
| go_gc_duration_seconds | summary | ins, instance, ip, job, cls, quantile |
A summary of the pause duration of garbage collection cycles. |
| go_gc_duration_seconds_count | Unknown | ins, instance, ip, job, cls |
N/A |
| go_gc_duration_seconds_sum | Unknown | ins, instance, ip, job, cls |
N/A |
| go_gc_gogc_percent | gauge | ins, instance, ip, job, cls |
Heap size target percentage configured by the user, otherwise 100. This value is set by the GOGC environment variable, and the runtime/debug.SetGCPercent function. |
| go_gc_gomemlimit_bytes | gauge | ins, instance, ip, job, cls |
Go runtime memory limit configured by the user, otherwise math.MaxInt64. This value is set by the GOMEMLIMIT environment variable, and the runtime/debug.SetMemoryLimit function. |
| go_gc_heap_allocs_by_size_bytes_bucket | Unknown | ins, instance, ip, le, job, cls |
N/A |
| go_gc_heap_allocs_by_size_bytes_count | Unknown | ins, instance, ip, job, cls |
N/A |
| go_gc_heap_allocs_by_size_bytes_sum | Unknown | ins, instance, ip, job, cls |
N/A |
| go_gc_heap_allocs_bytes_total | Unknown | ins, instance, ip, job, cls |
N/A |
| go_gc_heap_allocs_objects_total | Unknown | ins, instance, ip, job, cls |
N/A |
| go_gc_heap_frees_by_size_bytes_bucket | Unknown | ins, instance, ip, le, job, cls |
N/A |
| go_gc_heap_frees_by_size_bytes_count | Unknown | ins, instance, ip, job, cls |
N/A |
| go_gc_heap_frees_by_size_bytes_sum | Unknown | ins, instance, ip, job, cls |
N/A |
| go_gc_heap_frees_bytes_total | Unknown | ins, instance, ip, job, cls |
N/A |
| go_gc_heap_frees_objects_total | Unknown | ins, instance, ip, job, cls |
N/A |
| go_gc_heap_goal_bytes | gauge | ins, instance, ip, job, cls |
Heap size target for the end of the GC cycle. |
| go_gc_heap_live_bytes | gauge | ins, instance, ip, job, cls |
Heap memory occupied by live objects that were marked by the previous GC. |
| go_gc_heap_objects_objects | gauge | ins, instance, ip, job, cls |
Number of objects, live or unswept, occupying heap memory. |
| go_gc_heap_tiny_allocs_objects_total | Unknown | ins, instance, ip, job, cls |
N/A |
| go_gc_limiter_last_enabled_gc_cycle | gauge | ins, instance, ip, job, cls |
GC cycle the last time the GC CPU limiter was enabled. This metric is useful for diagnosing the root cause of an out-of-memory error, because the limiter trades memory for CPU time when the GC’s CPU time gets too high. This is most likely to occur with use of SetMemoryLimit. The first GC cycle is cycle 1, so a value of 0 indicates that it was never enabled. |
| go_gc_pauses_seconds_bucket | Unknown | ins, instance, ip, le, job, cls |
N/A |
| go_gc_pauses_seconds_count | Unknown | ins, instance, ip, job, cls |
N/A |
| go_gc_pauses_seconds_sum | Unknown | ins, instance, ip, job, cls |
N/A |
| go_gc_scan_globals_bytes | gauge | ins, instance, ip, job, cls |
The total amount of global variable space that is scannable. |
| go_gc_scan_heap_bytes | gauge | ins, instance, ip, job, cls |
The total amount of heap space that is scannable. |
| go_gc_scan_stack_bytes | gauge | ins, instance, ip, job, cls |
The number of bytes of stack that were scanned last GC cycle. |
| go_gc_scan_total_bytes | gauge | ins, instance, ip, job, cls |
The total amount space that is scannable. Sum of all metrics in /gc/scan. |
| go_gc_stack_starting_size_bytes | gauge | ins, instance, ip, job, cls |
The stack size of new goroutines. |
| go_godebug_non_default_behavior_execerrdot_events_total | Unknown | ins, instance, ip, job, cls |
N/A |
| go_godebug_non_default_behavior_gocachehash_events_total | Unknown | ins, instance, ip, job, cls |
N/A |
| go_godebug_non_default_behavior_gocachetest_events_total | Unknown | ins, instance, ip, job, cls |
N/A |
| go_godebug_non_default_behavior_gocacheverify_events_total | Unknown | ins, instance, ip, job, cls |
N/A |
| go_godebug_non_default_behavior_http2client_events_total | Unknown | ins, instance, ip, job, cls |
N/A |
| go_godebug_non_default_behavior_http2server_events_total | Unknown | ins, instance, ip, job, cls |
N/A |
| go_godebug_non_default_behavior_installgoroot_events_total | Unknown | ins, instance, ip, job, cls |
N/A |
| go_godebug_non_default_behavior_jstmpllitinterp_events_total | Unknown | ins, instance, ip, job, cls |
N/A |
| go_godebug_non_default_behavior_multipartmaxheaders_events_total | Unknown | ins, instance, ip, job, cls |
N/A |
| go_godebug_non_default_behavior_multipartmaxparts_events_total | Unknown | ins, instance, ip, job, cls |
N/A |
| go_godebug_non_default_behavior_multipathtcp_events_total | Unknown | ins, instance, ip, job, cls |
N/A |
| go_godebug_non_default_behavior_panicnil_events_total | Unknown | ins, instance, ip, job, cls |
N/A |
| go_godebug_non_default_behavior_randautoseed_events_total | Unknown | ins, instance, ip, job, cls |
N/A |
| go_godebug_non_default_behavior_tarinsecurepath_events_total | Unknown | ins, instance, ip, job, cls |
N/A |
| go_godebug_non_default_behavior_tlsmaxrsasize_events_total | Unknown | ins, instance, ip, job, cls |
N/A |
| go_godebug_non_default_behavior_x509sha1_events_total | Unknown | ins, instance, ip, job, cls |
N/A |
| go_godebug_non_default_behavior_x509usefallbackroots_events_total | Unknown | ins, instance, ip, job, cls |
N/A |
| go_godebug_non_default_behavior_zipinsecurepath_events_total | Unknown | ins, instance, ip, job, cls |
N/A |
| go_goroutines | gauge | ins, instance, ip, job, cls |
Number of goroutines that currently exist. |
| go_info | gauge | version, ins, instance, ip, job, cls |
Information about the Go environment. |
| go_memory_classes_heap_free_bytes | gauge | ins, instance, ip, job, cls |
Memory that is completely free and eligible to be returned to the underlying system, but has not been. This metric is the runtime’s estimate of free address space that is backed by physical memory. |
| go_memory_classes_heap_objects_bytes | gauge | ins, instance, ip, job, cls |
Memory occupied by live objects and dead objects that have not yet been marked free by the garbage collector. |
| go_memory_classes_heap_released_bytes | gauge | ins, instance, ip, job, cls |
Memory that is completely free and has been returned to the underlying system. This metric is the runtime’s estimate of free address space that is still mapped into the process, but is not backed by physical memory. |
| go_memory_classes_heap_stacks_bytes | gauge | ins, instance, ip, job, cls |
Memory allocated from the heap that is reserved for stack space, whether or not it is currently in-use. Currently, this represents all stack memory for goroutines. It also includes all OS thread stacks in non-cgo programs. Note that stacks may be allocated differently in the future, and this may change. |
| go_memory_classes_heap_unused_bytes | gauge | ins, instance, ip, job, cls |
Memory that is reserved for heap objects but is not currently used to hold heap objects. |
| go_memory_classes_metadata_mcache_free_bytes | gauge | ins, instance, ip, job, cls |
Memory that is reserved for runtime mcache structures, but not in-use. |
| go_memory_classes_metadata_mcache_inuse_bytes | gauge | ins, instance, ip, job, cls |
Memory that is occupied by runtime mcache structures that are currently being used. |
| go_memory_classes_metadata_mspan_free_bytes | gauge | ins, instance, ip, job, cls |
Memory that is reserved for runtime mspan structures, but not in-use. |
| go_memory_classes_metadata_mspan_inuse_bytes | gauge | ins, instance, ip, job, cls |
Memory that is occupied by runtime mspan structures that are currently being used. |
| go_memory_classes_metadata_other_bytes | gauge | ins, instance, ip, job, cls |
Memory that is reserved for or used to hold runtime metadata. |
| go_memory_classes_os_stacks_bytes | gauge | ins, instance, ip, job, cls |
Stack memory allocated by the underlying operating system. In non-cgo programs this metric is currently zero. This may change in the future.In cgo programs this metric includes OS thread stacks allocated directly from the OS. Currently, this only accounts for one stack in c-shared and c-archive build modes, and other sources of stacks from the OS are not measured. This too may change in the future. |
| go_memory_classes_other_bytes | gauge | ins, instance, ip, job, cls |
Memory used by execution trace buffers, structures for debugging the runtime, finalizer and profiler specials, and more. |
| go_memory_classes_profiling_buckets_bytes | gauge | ins, instance, ip, job, cls |
Memory that is used by the stack trace hash map used for profiling. |
| go_memory_classes_total_bytes | gauge | ins, instance, ip, job, cls |
All memory mapped by the Go runtime into the current process as read-write. Note that this does not include memory mapped by code called via cgo or via the syscall package. Sum of all metrics in /memory/classes. |
| go_memstats_alloc_bytes | counter | ins, instance, ip, job, cls |
Total number of bytes allocated, even if freed. |
| go_memstats_alloc_bytes_total | counter | ins, instance, ip, job, cls |
Total number of bytes allocated, even if freed. |
| go_memstats_buck_hash_sys_bytes | gauge | ins, instance, ip, job, cls |
Number of bytes used by the profiling bucket hash table. |
| go_memstats_frees_total | counter | ins, instance, ip, job, cls |
Total number of frees. |
| go_memstats_gc_sys_bytes | gauge | ins, instance, ip, job, cls |
Number of bytes used for garbage collection system metadata. |
| go_memstats_heap_alloc_bytes | gauge | ins, instance, ip, job, cls |
Number of heap bytes allocated and still in use. |
| go_memstats_heap_idle_bytes | gauge | ins, instance, ip, job, cls |
Number of heap bytes waiting to be used. |
| go_memstats_heap_inuse_bytes | gauge | ins, instance, ip, job, cls |
Number of heap bytes that are in use. |
| go_memstats_heap_objects | gauge | ins, instance, ip, job, cls |
Number of allocated objects. |
| go_memstats_heap_released_bytes | gauge | ins, instance, ip, job, cls |
Number of heap bytes released to OS. |
| go_memstats_heap_sys_bytes | gauge | ins, instance, ip, job, cls |
Number of heap bytes obtained from system. |
| go_memstats_last_gc_time_seconds | gauge | ins, instance, ip, job, cls |
Number of seconds since 1970 of last garbage collection. |
| go_memstats_lookups_total | counter | ins, instance, ip, job, cls |
Total number of pointer lookups. |
| go_memstats_mallocs_total | counter | ins, instance, ip, job, cls |
Total number of mallocs. |
| go_memstats_mcache_inuse_bytes | gauge | ins, instance, ip, job, cls |
Number of bytes in use by mcache structures. |
| go_memstats_mcache_sys_bytes | gauge | ins, instance, ip, job, cls |
Number of bytes used for mcache structures obtained from system. |
| go_memstats_mspan_inuse_bytes | gauge | ins, instance, ip, job, cls |
Number of bytes in use by mspan structures. |
| go_memstats_mspan_sys_bytes | gauge | ins, instance, ip, job, cls |
Number of bytes used for mspan structures obtained from system. |
| go_memstats_next_gc_bytes | gauge | ins, instance, ip, job, cls |
Number of heap bytes when next garbage collection will take place. |
| go_memstats_other_sys_bytes | gauge | ins, instance, ip, job, cls |
Number of bytes used for other system allocations. |
| go_memstats_stack_inuse_bytes | gauge | ins, instance, ip, job, cls |
Number of bytes in use by the stack allocator. |
| go_memstats_stack_sys_bytes | gauge | ins, instance, ip, job, cls |
Number of bytes obtained from system for stack allocator. |
| go_memstats_sys_bytes | gauge | ins, instance, ip, job, cls |
Number of bytes obtained from system. |
| go_sched_gomaxprocs_threads | gauge | ins, instance, ip, job, cls |
The current runtime.GOMAXPROCS setting, or the number of operating system threads that can execute user-level Go code simultaneously. |
| go_sched_goroutines_goroutines | gauge | ins, instance, ip, job, cls |
Count of live goroutines. |
| go_sched_latencies_seconds_bucket | Unknown | ins, instance, ip, le, job, cls |
N/A |
| go_sched_latencies_seconds_count | Unknown | ins, instance, ip, job, cls |
N/A |
| go_sched_latencies_seconds_sum | Unknown | ins, instance, ip, job, cls |
N/A |
| go_sql_stats_connections_blocked_seconds | unknown | ins, instance, db_name, ip, job, cls |
The total time blocked waiting for a new connection. |
| go_sql_stats_connections_closed_max_idle | unknown | ins, instance, db_name, ip, job, cls |
The total number of connections closed due to SetMaxIdleConns. |
| go_sql_stats_connections_closed_max_idle_time | unknown | ins, instance, db_name, ip, job, cls |
The total number of connections closed due to SetConnMaxIdleTime. |
| go_sql_stats_connections_closed_max_lifetime | unknown | ins, instance, db_name, ip, job, cls |
The total number of connections closed due to SetConnMaxLifetime. |
| go_sql_stats_connections_idle | gauge | ins, instance, db_name, ip, job, cls |
The number of idle connections. |
| go_sql_stats_connections_in_use | gauge | ins, instance, db_name, ip, job, cls |
The number of connections currently in use. |
| go_sql_stats_connections_max_open | gauge | ins, instance, db_name, ip, job, cls |
Maximum number of open connections to the database. |
| go_sql_stats_connections_open | gauge | ins, instance, db_name, ip, job, cls |
The number of established connections both in use and idle. |
| go_sql_stats_connections_waited_for | unknown | ins, instance, db_name, ip, job, cls |
The total number of connections waited for. |
| go_sync_mutex_wait_total_seconds_total | Unknown | ins, instance, ip, job, cls |
N/A |
| go_threads | gauge | ins, instance, ip, job, cls |
Number of OS threads created. |
| grafana_access_evaluation_count | unknown | ins, instance, ip, job, cls |
number of evaluation calls |
| grafana_access_evaluation_duration_bucket | Unknown | ins, instance, ip, le, job, cls |
N/A |
| grafana_access_evaluation_duration_count | Unknown | ins, instance, ip, job, cls |
N/A |
| grafana_access_evaluation_duration_sum | Unknown | ins, instance, ip, job, cls |
N/A |
| grafana_access_permissions_duration_bucket | Unknown | ins, instance, ip, le, job, cls |
N/A |
| grafana_access_permissions_duration_count | Unknown | ins, instance, ip, job, cls |
N/A |
| grafana_access_permissions_duration_sum | Unknown | ins, instance, ip, job, cls |
N/A |
| grafana_aggregator_discovery_aggregation_count_total | Unknown | ins, instance, ip, job, cls |
N/A |
| grafana_alerting_active_alerts | gauge | ins, instance, ip, job, cls |
amount of active alerts |
| grafana_alerting_active_configurations | gauge | ins, instance, ip, job, cls |
The number of active Alertmanager configurations. |
| grafana_alerting_alertmanager_config_match | gauge | ins, instance, ip, job, cls |
The total number of match |
| grafana_alerting_alertmanager_config_match_re | gauge | ins, instance, ip, job, cls |
The total number of matchRE |
| grafana_alerting_alertmanager_config_matchers | gauge | ins, instance, ip, job, cls |
The total number of matchers |
| grafana_alerting_alertmanager_config_object_matchers | gauge | ins, instance, ip, job, cls |
The total number of object_matchers |
| grafana_alerting_discovered_configurations | gauge | ins, instance, ip, job, cls |
The number of organizations we’ve discovered that require an Alertmanager configuration. |
| grafana_alerting_dispatcher_aggregation_groups | gauge | ins, instance, ip, job, cls |
Number of active aggregation groups |
| grafana_alerting_dispatcher_alert_processing_duration_seconds_count | Unknown | ins, instance, ip, job, cls |
N/A |
| grafana_alerting_dispatcher_alert_processing_duration_seconds_sum | Unknown | ins, instance, ip, job, cls |
N/A |
| grafana_alerting_execution_time_milliseconds | summary | ins, instance, ip, job, cls, quantile |
summary of alert execution duration |
| grafana_alerting_execution_time_milliseconds_count | Unknown | ins, instance, ip, job, cls |
N/A |
| grafana_alerting_execution_time_milliseconds_sum | Unknown | ins, instance, ip, job, cls |
N/A |
| grafana_alerting_nflog_gc_duration_seconds_count | Unknown | ins, instance, ip, job, cls |
N/A |
| grafana_alerting_nflog_gc_duration_seconds_sum | Unknown | ins, instance, ip, job, cls |
N/A |
| grafana_alerting_nflog_gossip_messages_propagated_total | Unknown | ins, instance, ip, job, cls |
N/A |
| grafana_alerting_nflog_queries_total | Unknown | ins, instance, ip, job, cls |
N/A |
| grafana_alerting_nflog_query_duration_seconds_bucket | Unknown | ins, instance, ip, le, job, cls |
N/A |
| grafana_alerting_nflog_query_duration_seconds_count | Unknown | ins, instance, ip, job, cls |
N/A |
| grafana_alerting_nflog_query_duration_seconds_sum | Unknown | ins, instance, ip, job, cls |
N/A |
| grafana_alerting_nflog_query_errors_total | Unknown | ins, instance, ip, job, cls |
N/A |
| grafana_alerting_nflog_snapshot_duration_seconds_count | Unknown | ins, instance, ip, job, cls |
N/A |
| grafana_alerting_nflog_snapshot_duration_seconds_sum | Unknown | ins, instance, ip, job, cls |
N/A |
| grafana_alerting_nflog_snapshot_size_bytes | gauge | ins, instance, ip, job, cls |
Size of the last notification log snapshot in bytes. |
| grafana_alerting_notification_latency_seconds_bucket | Unknown | ins, instance, ip, le, job, cls |
N/A |
| grafana_alerting_notification_latency_seconds_count | Unknown | ins, instance, ip, job, cls |
N/A |
| grafana_alerting_notification_latency_seconds_sum | Unknown | ins, instance, ip, job, cls |
N/A |
| grafana_alerting_schedule_alert_rules | gauge | ins, instance, ip, job, cls |
The number of alert rules that could be considered for evaluation at the next tick. |
| grafana_alerting_schedule_alert_rules_hash | gauge | ins, instance, ip, job, cls |
A hash of the alert rules that could be considered for evaluation at the next tick. |
| grafana_alerting_schedule_periodic_duration_seconds_bucket | Unknown | ins, instance, ip, le, job, cls |
N/A |
| grafana_alerting_schedule_periodic_duration_seconds_count | Unknown | ins, instance, ip, job, cls |
N/A |
| grafana_alerting_schedule_periodic_duration_seconds_sum | Unknown | ins, instance, ip, job, cls |
N/A |
| grafana_alerting_schedule_query_alert_rules_duration_seconds_bucket | Unknown | ins, instance, ip, le, job, cls |
N/A |
| grafana_alerting_schedule_query_alert_rules_duration_seconds_count | Unknown | ins, instance, ip, job, cls |
N/A |
| grafana_alerting_schedule_query_alert_rules_duration_seconds_sum | Unknown | ins, instance, ip, job, cls |
N/A |
| grafana_alerting_scheduler_behind_seconds | gauge | ins, instance, ip, job, cls |
The total number of seconds the scheduler is behind. |
| grafana_alerting_silences_gc_duration_seconds_count | Unknown | ins, instance, ip, job, cls |
N/A |
| grafana_alerting_silences_gc_duration_seconds_sum | Unknown | ins, instance, ip, job, cls |
N/A |
| grafana_alerting_silences_gossip_messages_propagated_total | Unknown | ins, instance, ip, job, cls |
N/A |
| grafana_alerting_silences_queries_total | Unknown | ins, instance, ip, job, cls |
N/A |
| grafana_alerting_silences_query_duration_seconds_bucket | Unknown | ins, instance, ip, le, job, cls |
N/A |
| grafana_alerting_silences_query_duration_seconds_count | Unknown | ins, instance, ip, job, cls |
N/A |
| grafana_alerting_silences_query_duration_seconds_sum | Unknown | ins, instance, ip, job, cls |
N/A |
| grafana_alerting_silences_query_errors_total | Unknown | ins, instance, ip, job, cls |
N/A |
| grafana_alerting_silences_snapshot_duration_seconds_count | Unknown | ins, instance, ip, job, cls |
N/A |
| grafana_alerting_silences_snapshot_duration_seconds_sum | Unknown | ins, instance, ip, job, cls |
N/A |
| grafana_alerting_silences_snapshot_size_bytes | gauge | ins, instance, ip, job, cls |
Size of the last silence snapshot in bytes. |
| grafana_alerting_state_calculation_duration_seconds_bucket | Unknown | ins, instance, ip, le, job, cls |
N/A |
| grafana_alerting_state_calculation_duration_seconds_count | Unknown | ins, instance, ip, job, cls |
N/A |
| grafana_alerting_state_calculation_duration_seconds_sum | Unknown | ins, instance, ip, job, cls |
N/A |
| grafana_alerting_state_history_writes_bytes_total | Unknown | ins, instance, ip, job, cls |
N/A |
| grafana_alerting_ticker_interval_seconds | gauge | ins, instance, ip, job, cls |
Interval at which the ticker is meant to tick. |
| grafana_alerting_ticker_last_consumed_tick_timestamp_seconds | gauge | ins, instance, ip, job, cls |
Timestamp of the last consumed tick in seconds. |
| grafana_alerting_ticker_next_tick_timestamp_seconds | gauge | ins, instance, ip, job, cls |
Timestamp of the next tick in seconds before it is consumed. |
| grafana_api_admin_user_created_total | Unknown | ins, instance, ip, job, cls |
N/A |
| grafana_api_dashboard_get_milliseconds | summary | ins, instance, ip, job, cls, quantile |
summary for dashboard get duration |
| grafana_api_dashboard_get_milliseconds_count | Unknown | ins, instance, ip, job, cls |
N/A |
| grafana_api_dashboard_get_milliseconds_sum | Unknown | ins, instance, ip, job, cls |
N/A |
| grafana_api_dashboard_save_milliseconds | summary | ins, instance, ip, job, cls, quantile |
summary for dashboard save duration |
| grafana_api_dashboard_save_milliseconds_count | Unknown | ins, instance, ip, job, cls |
N/A |
| grafana_api_dashboard_save_milliseconds_sum | Unknown | ins, instance, ip, job, cls |
N/A |
| grafana_api_dashboard_search_milliseconds | summary | ins, instance, ip, job, cls, quantile |
summary for dashboard search duration |
| grafana_api_dashboard_search_milliseconds_count | Unknown | ins, instance, ip, job, cls |
N/A |
| grafana_api_dashboard_search_milliseconds_sum | Unknown | ins, instance, ip, job, cls |
N/A |
| grafana_api_dashboard_snapshot_create_total | Unknown | ins, instance, ip, job, cls |
N/A |
| grafana_api_dashboard_snapshot_external_total | Unknown | ins, instance, ip, job, cls |
N/A |
| grafana_api_dashboard_snapshot_get_total | Unknown | ins, instance, ip, job, cls |
N/A |
| grafana_api_dataproxy_request_all_milliseconds | summary | ins, instance, ip, job, cls, quantile |
summary for dataproxy request duration |
| grafana_api_dataproxy_request_all_milliseconds_count | Unknown | ins, instance, ip, job, cls |
N/A |
| grafana_api_dataproxy_request_all_milliseconds_sum | Unknown | ins, instance, ip, job, cls |
N/A |
| grafana_api_login_oauth_total | Unknown | ins, instance, ip, job, cls |
N/A |
| grafana_api_login_post_total | Unknown | ins, instance, ip, job, cls |
N/A |
| grafana_api_login_saml_total | Unknown | ins, instance, ip, job, cls |
N/A |
| grafana_api_models_dashboard_insert_total | Unknown | ins, instance, ip, job, cls |
N/A |
| grafana_api_org_create_total | Unknown | ins, instance, ip, job, cls |
N/A |
| grafana_api_response_status_total | Unknown | ins, instance, ip, job, cls, code |
N/A |
| grafana_api_user_signup_completed_total | Unknown | ins, instance, ip, job, cls |
N/A |
| grafana_api_user_signup_invite_total | Unknown | ins, instance, ip, job, cls |
N/A |
| grafana_api_user_signup_started_total | Unknown | ins, instance, ip, job, cls |
N/A |
| grafana_apiserver_audit_event_total | Unknown | ins, instance, ip, job, cls |
N/A |
| grafana_apiserver_audit_requests_rejected_total | Unknown | ins, instance, ip, job, cls |
N/A |
| grafana_apiserver_client_certificate_expiration_seconds_bucket | Unknown | ins, instance, ip, le, job, cls |
N/A |
| grafana_apiserver_client_certificate_expiration_seconds_count | Unknown | ins, instance, ip, job, cls |
N/A |
| grafana_apiserver_client_certificate_expiration_seconds_sum | Unknown | ins, instance, ip, job, cls |
N/A |
| grafana_apiserver_envelope_encryption_dek_cache_fill_percent | gauge | ins, instance, ip, job, cls |
[ALPHA] Percent of the cache slots currently occupied by cached DEKs. |
| grafana_apiserver_flowcontrol_seat_fair_frac | gauge | ins, instance, ip, job, cls |
[ALPHA] Fair fraction of server’s concurrency to allocate to each priority level that can use it |
| grafana_apiserver_storage_data_key_generation_duration_seconds_bucket | Unknown | ins, instance, ip, le, job, cls |
N/A |
| grafana_apiserver_storage_data_key_generation_duration_seconds_count | Unknown | ins, instance, ip, job, cls |
N/A |
| grafana_apiserver_storage_data_key_generation_duration_seconds_sum | Unknown | ins, instance, ip, job, cls |
N/A |
| grafana_apiserver_storage_data_key_generation_failures_total | Unknown | ins, instance, ip, job, cls |
N/A |
| grafana_apiserver_storage_envelope_transformation_cache_misses_total | Unknown | ins, instance, ip, job, cls |
N/A |
| grafana_apiserver_tls_handshake_errors_total | Unknown | ins, instance, ip, job, cls |
N/A |
| grafana_apiserver_webhooks_x509_insecure_sha1_total | Unknown | ins, instance, ip, job, cls |
N/A |
| grafana_apiserver_webhooks_x509_missing_san_total | Unknown | ins, instance, ip, job, cls |
N/A |
| grafana_authn_authn_failed_authentication_total | Unknown | ins, instance, ip, job, cls |
N/A |
| grafana_authn_authn_successful_authentication_total | Unknown | ins, instance, ip, client, job, cls |
N/A |
| grafana_authn_authn_successful_login_total | Unknown | ins, instance, ip, client, job, cls |
N/A |
| grafana_aws_cloudwatch_get_metric_data_total | Unknown | ins, instance, ip, job, cls |
N/A |
| grafana_aws_cloudwatch_get_metric_statistics_total | Unknown | ins, instance, ip, job, cls |
N/A |
| grafana_aws_cloudwatch_list_metrics_total | Unknown | ins, instance, ip, job, cls |
N/A |
| grafana_build_info | gauge | revision, version, ins, instance, edition, ip, goversion, job, cls, branch |
A metric with a constant ‘1’ value labeled by version, revision, branch, and goversion from which Grafana was built |
| grafana_build_timestamp | gauge | revision, version, ins, instance, edition, ip, goversion, job, cls, branch |
A metric exposing when the binary was built in epoch |
| grafana_cardinality_enforcement_unexpected_categorizations_total | Unknown | ins, instance, ip, job, cls |
N/A |
| grafana_database_conn_idle | gauge | ins, instance, ip, job, cls |
The number of idle connections |
| grafana_database_conn_in_use | gauge | ins, instance, ip, job, cls |
The number of connections currently in use |
| grafana_database_conn_max_idle_closed_seconds | unknown | ins, instance, ip, job, cls |
The total number of connections closed due to SetConnMaxIdleTime |
| grafana_database_conn_max_idle_closed_total | Unknown | ins, instance, ip, job, cls |
N/A |
| grafana_database_conn_max_lifetime_closed_total | Unknown | ins, instance, ip, job, cls |
N/A |
| grafana_database_conn_max_open | gauge | ins, instance, ip, job, cls |
Maximum number of open connections to the database |
| grafana_database_conn_open | gauge | ins, instance, ip, job, cls |
The number of established connections both in use and idle |
| grafana_database_conn_wait_count_total | Unknown | ins, instance, ip, job, cls |
N/A |
| grafana_database_conn_wait_duration_seconds | unknown | ins, instance, ip, job, cls |
The total time blocked waiting for a new connection |
| grafana_datasource_request_duration_seconds_bucket | Unknown | datasource, ins, instance, method, ip, le, datasource_type, job, cls, code |
N/A |
| grafana_datasource_request_duration_seconds_count | Unknown | datasource, ins, instance, method, ip, datasource_type, job, cls, code |
N/A |
| grafana_datasource_request_duration_seconds_sum | Unknown | datasource, ins, instance, method, ip, datasource_type, job, cls, code |
N/A |
| grafana_datasource_request_in_flight | gauge | datasource, ins, instance, ip, datasource_type, job, cls |
A gauge of outgoing data source requests currently being sent by Grafana |
| grafana_datasource_request_total | Unknown | datasource, ins, instance, method, ip, datasource_type, job, cls, code |
N/A |
| grafana_datasource_response_size_bytes_bucket | Unknown | datasource, ins, instance, ip, le, datasource_type, job, cls |
N/A |
| grafana_datasource_response_size_bytes_count | Unknown | datasource, ins, instance, ip, datasource_type, job, cls |
N/A |
| grafana_datasource_response_size_bytes_sum | Unknown | datasource, ins, instance, ip, datasource_type, job, cls |
N/A |
| grafana_db_datasource_query_by_id_total | Unknown | ins, instance, ip, job, cls |
N/A |
| grafana_disabled_metrics_total | Unknown | ins, instance, ip, job, cls |
N/A |
| grafana_emails_sent_failed | unknown | ins, instance, ip, job, cls |
Number of emails Grafana failed to send |
| grafana_emails_sent_total | Unknown | ins, instance, ip, job, cls |
N/A |
| grafana_encryption_cache_reads_total | Unknown | ins, instance, method, ip, hit, job, cls |
N/A |
| grafana_encryption_ops_total | Unknown | ins, instance, ip, success, operation, job, cls |
N/A |
| grafana_environment_info | gauge | version, ins, instance, ip, job, cls, commit |
A metric with a constant ‘1’ value labeled by environment information about the running instance. |
| grafana_feature_toggles_info | gauge | ins, instance, ip, job, cls |
info metric that exposes what feature toggles are enabled or not |
| grafana_frontend_boot_css_time_seconds_bucket | Unknown | ins, instance, ip, le, job, cls |
N/A |
| grafana_frontend_boot_css_time_seconds_count | Unknown | ins, instance, ip, job, cls |
N/A |
| grafana_frontend_boot_css_time_seconds_sum | Unknown | ins, instance, ip, job, cls |
N/A |
| grafana_frontend_boot_first_contentful_paint_time_seconds_bucket | Unknown | ins, instance, ip, le, job, cls |
N/A |
| grafana_frontend_boot_first_contentful_paint_time_seconds_count | Unknown | ins, instance, ip, job, cls |
N/A |
| grafana_frontend_boot_first_contentful_paint_time_seconds_sum | Unknown | ins, instance, ip, job, cls |
N/A |
| grafana_frontend_boot_first_paint_time_seconds_bucket | Unknown | ins, instance, ip, le, job, cls |
N/A |
| grafana_frontend_boot_first_paint_time_seconds_count | Unknown | ins, instance, ip, job, cls |
N/A |
| grafana_frontend_boot_first_paint_time_seconds_sum | Unknown | ins, instance, ip, job, cls |
N/A |
| grafana_frontend_boot_js_done_time_seconds_bucket | Unknown | ins, instance, ip, le, job, cls |
N/A |
| grafana_frontend_boot_js_done_time_seconds_count | Unknown | ins, instance, ip, job, cls |
N/A |
| grafana_frontend_boot_js_done_time_seconds_sum | Unknown | ins, instance, ip, job, cls |
N/A |
| grafana_frontend_boot_load_time_seconds_bucket | Unknown | ins, instance, ip, le, job, cls |
N/A |
| grafana_frontend_boot_load_time_seconds_count | Unknown | ins, instance, ip, job, cls |
N/A |
| grafana_frontend_boot_load_time_seconds_sum | Unknown | ins, instance, ip, job, cls |
N/A |
| grafana_frontend_plugins_preload_ms_bucket | Unknown | ins, instance, ip, le, job, cls |
N/A |
| grafana_frontend_plugins_preload_ms_count | Unknown | ins, instance, ip, job, cls |
N/A |
| grafana_frontend_plugins_preload_ms_sum | Unknown | ins, instance, ip, job, cls |
N/A |
| grafana_hidden_metrics_total | Unknown | ins, instance, ip, job, cls |
N/A |
| grafana_http_request_duration_seconds_bucket | Unknown | ins, instance, method, ip, le, job, cls, status_code, handler |
N/A |
| grafana_http_request_duration_seconds_count | Unknown | ins, instance, method, ip, job, cls, status_code, handler |
N/A |
| grafana_http_request_duration_seconds_sum | Unknown | ins, instance, method, ip, job, cls, status_code, handler |
N/A |
| grafana_http_request_in_flight | gauge | ins, instance, ip, job, cls |
A gauge of requests currently being served by Grafana. |
| grafana_idforwarding_idforwarding_failed_token_signing_total | Unknown | ins, instance, ip, job, cls |
N/A |
| grafana_idforwarding_idforwarding_token_signing_duration_seconds_bucket | Unknown | ins, instance, ip, le, job, cls |
N/A |
| grafana_idforwarding_idforwarding_token_signing_duration_seconds_count | Unknown | ins, instance, ip, job, cls |
N/A |
| grafana_idforwarding_idforwarding_token_signing_duration_seconds_sum | Unknown | ins, instance, ip, job, cls |
N/A |
| grafana_idforwarding_idforwarding_token_signing_from_cache_total | Unknown | ins, instance, ip, job, cls |
N/A |
| grafana_idforwarding_idforwarding_token_signing_total | Unknown | ins, instance, ip, job, cls |
N/A |
| grafana_instance_start_total | Unknown | ins, instance, ip, job, cls |
N/A |
| grafana_ldap_users_sync_execution_time | summary | ins, instance, ip, job, cls, quantile |
summary for LDAP users sync execution duration |
| grafana_ldap_users_sync_execution_time_count | Unknown | ins, instance, ip, job, cls |
N/A |
| grafana_ldap_users_sync_execution_time_sum | Unknown | ins, instance, ip, job, cls |
N/A |
| grafana_live_client_command_duration_seconds | summary | ins, instance, method, ip, job, cls, quantile |
Client command duration summary. |
| grafana_live_client_command_duration_seconds_count | Unknown | ins, instance, method, ip, job, cls |
N/A |
| grafana_live_client_command_duration_seconds_sum | Unknown | ins, instance, method, ip, job, cls |
N/A |
| grafana_live_client_num_reply_errors | unknown | ins, instance, method, ip, job, cls, code |
Number of errors in replies sent to clients. |
| grafana_live_client_num_server_disconnects | unknown | ins, instance, ip, job, cls, code |
Number of server initiated disconnects. |
| grafana_live_client_recover | unknown | ins, instance, ip, recovered, job, cls |
Count of recover operations. |
| grafana_live_node_action_count | unknown | action, ins, instance, ip, job, cls |
Number of node actions called. |
| grafana_live_node_build | gauge | version, ins, instance, ip, job, cls |
Node build info. |
| grafana_live_node_messages_received_count | unknown | ins, instance, ip, type, job, cls |
Number of messages received. |
| grafana_live_node_messages_sent_count | unknown | ins, instance, ip, type, job, cls |
Number of messages sent. |
| grafana_live_node_num_channels | gauge | ins, instance, ip, job, cls |
Number of channels with one or more subscribers. |
| grafana_live_node_num_clients | gauge | ins, instance, ip, job, cls |
Number of clients connected. |
| grafana_live_node_num_nodes | gauge | ins, instance, ip, job, cls |
Number of nodes in cluster. |
| grafana_live_node_num_subscriptions | gauge | ins, instance, ip, job, cls |
Number of subscriptions. |
| grafana_live_node_num_users | gauge | ins, instance, ip, job, cls |
Number of unique users connected. |
| grafana_live_transport_connect_count | unknown | ins, instance, ip, transport, job, cls |
Number of connections to specific transport. |
| grafana_live_transport_messages_sent | unknown | ins, instance, ip, transport, job, cls |
Number of messages sent over specific transport. |
| grafana_loki_plugin_parse_response_duration_seconds_bucket | Unknown | endpoint, ins, instance, ip, le, status, job, cls |
N/A |
| grafana_loki_plugin_parse_response_duration_seconds_count | Unknown | endpoint, ins, instance, ip, status, job, cls |
N/A |
| grafana_loki_plugin_parse_response_duration_seconds_sum | Unknown | endpoint, ins, instance, ip, status, job, cls |
N/A |
| grafana_page_response_status_total | Unknown | ins, instance, ip, job, cls, code |
N/A |
| grafana_plugin_build_info | gauge | version, signature_status, ins, instance, plugin_type, ip, plugin_id, job, cls |
A metric with a constant ‘1’ value labeled by pluginId, pluginType and version from which Grafana plugin was built |
| grafana_plugin_request_duration_milliseconds_bucket | Unknown | endpoint, ins, instance, target, ip, le, plugin_id, job, cls |
N/A |
| grafana_plugin_request_duration_milliseconds_count | Unknown | endpoint, ins, instance, target, ip, plugin_id, job, cls |
N/A |
| grafana_plugin_request_duration_milliseconds_sum | Unknown | endpoint, ins, instance, target, ip, plugin_id, job, cls |
N/A |
| grafana_plugin_request_duration_seconds_bucket | Unknown | endpoint, ins, instance, target, ip, le, status, plugin_id, source, job, cls |
N/A |
| grafana_plugin_request_duration_seconds_count | Unknown | endpoint, ins, instance, target, ip, status, plugin_id, source, job, cls |
N/A |
| grafana_plugin_request_duration_seconds_sum | Unknown | endpoint, ins, instance, target, ip, status, plugin_id, source, job, cls |
N/A |
| grafana_plugin_request_size_bytes_bucket | Unknown | endpoint, ins, instance, target, ip, le, plugin_id, source, job, cls |
N/A |
| grafana_plugin_request_size_bytes_count | Unknown | endpoint, ins, instance, target, ip, plugin_id, source, job, cls |
N/A |
| grafana_plugin_request_size_bytes_sum | Unknown | endpoint, ins, instance, target, ip, plugin_id, source, job, cls |
N/A |
| grafana_plugin_request_total | Unknown | endpoint, ins, instance, target, ip, status, plugin_id, job, cls |
N/A |
| grafana_process_cpu_seconds_total | Unknown | ins, instance, ip, job, cls |
N/A |
| grafana_process_max_fds | gauge | ins, instance, ip, job, cls |
Maximum number of open file descriptors. |
| grafana_process_open_fds | gauge | ins, instance, ip, job, cls |
Number of open file descriptors. |
| grafana_process_resident_memory_bytes | gauge | ins, instance, ip, job, cls |
Resident memory size in bytes. |
| grafana_process_start_time_seconds | gauge | ins, instance, ip, job, cls |
Start time of the process since unix epoch in seconds. |
| grafana_process_virtual_memory_bytes | gauge | ins, instance, ip, job, cls |
Virtual memory size in bytes. |
| grafana_process_virtual_memory_max_bytes | gauge | ins, instance, ip, job, cls |
Maximum amount of virtual memory available in bytes. |
| grafana_prometheus_plugin_backend_request_count | unknown | endpoint, ins, instance, ip, status, errorSource, job, cls |
The total amount of prometheus backend plugin requests |
| grafana_proxy_response_status_total | Unknown | ins, instance, ip, job, cls, code |
N/A |
| grafana_public_dashboard_request_count | unknown | ins, instance, ip, job, cls |
counter for public dashboards requests |
| grafana_registered_metrics_total | Unknown | ins, instance, ip, stability_level, deprecated_version, job, cls |
N/A |
| grafana_rendering_queue_size | gauge | ins, instance, ip, job, cls |
size of rendering queue |
| grafana_search_dashboard_search_failures_duration_seconds_bucket | Unknown | ins, instance, ip, le, job, cls |
N/A |
| grafana_search_dashboard_search_failures_duration_seconds_count | Unknown | ins, instance, ip, job, cls |
N/A |
| grafana_search_dashboard_search_failures_duration_seconds_sum | Unknown | ins, instance, ip, job, cls |
N/A |
| grafana_search_dashboard_search_successes_duration_seconds_bucket | Unknown | ins, instance, ip, le, job, cls |
N/A |
| grafana_search_dashboard_search_successes_duration_seconds_count | Unknown | ins, instance, ip, job, cls |
N/A |
| grafana_search_dashboard_search_successes_duration_seconds_sum | Unknown | ins, instance, ip, job, cls |
N/A |
| grafana_stat_active_users | gauge | ins, instance, ip, job, cls |
number of active users |
| grafana_stat_total_orgs | gauge | ins, instance, ip, job, cls |
total amount of orgs |
| grafana_stat_total_playlists | gauge | ins, instance, ip, job, cls |
total amount of playlists |
| grafana_stat_total_service_account_tokens | gauge | ins, instance, ip, job, cls |
total amount of service account tokens |
| grafana_stat_total_service_accounts | gauge | ins, instance, ip, job, cls |
total amount of service accounts |
| grafana_stat_total_service_accounts_role_none | gauge | ins, instance, ip, job, cls |
total amount of service accounts with no role |
| grafana_stat_total_teams | gauge | ins, instance, ip, job, cls |
total amount of teams |
| grafana_stat_total_users | gauge | ins, instance, ip, job, cls |
total amount of users |
| grafana_stat_totals_active_admins | gauge | ins, instance, ip, job, cls |
total amount of active admins |
| grafana_stat_totals_active_editors | gauge | ins, instance, ip, job, cls |
total amount of active editors |
| grafana_stat_totals_active_viewers | gauge | ins, instance, ip, job, cls |
total amount of active viewers |
| grafana_stat_totals_admins | gauge | ins, instance, ip, job, cls |
total amount of admins |
| grafana_stat_totals_alert_rules | gauge | ins, instance, ip, job, cls |
total amount of alert rules in the database |
| grafana_stat_totals_annotations | gauge | ins, instance, ip, job, cls |
total amount of annotations in the database |
| grafana_stat_totals_correlations | gauge | ins, instance, ip, job, cls |
total amount of correlations |
| grafana_stat_totals_dashboard | gauge | ins, instance, ip, job, cls |
total amount of dashboards |
| grafana_stat_totals_dashboard_versions | gauge | ins, instance, ip, job, cls |
total amount of dashboard versions in the database |
| grafana_stat_totals_data_keys | gauge | ins, instance, ip, job, cls, active |
total amount of data keys in the database |
| grafana_stat_totals_datasource | gauge | ins, instance, ip, plugin_id, job, cls |
total number of defined datasources, labeled by pluginId |
| grafana_stat_totals_editors | gauge | ins, instance, ip, job, cls |
total amount of editors |
| grafana_stat_totals_folder | gauge | ins, instance, ip, job, cls |
total amount of folders |
| grafana_stat_totals_library_panels | gauge | ins, instance, ip, job, cls |
total amount of library panels in the database |
| grafana_stat_totals_library_variables | gauge | ins, instance, ip, job, cls |
total amount of library variables in the database |
| grafana_stat_totals_public_dashboard | gauge | ins, instance, ip, job, cls |
total amount of public dashboards |
| grafana_stat_totals_rule_groups | gauge | ins, instance, ip, job, cls |
total amount of alert rule groups in the database |
| grafana_stat_totals_viewers | gauge | ins, instance, ip, job, cls |
total amount of viewers |
| infra_up | Unknown | ins, instance, ip, job, cls |
N/A |
| jaeger_tracer_baggage_restrictions_updates_total | Unknown | result, ins, instance, ip, job, cls |
N/A |
| jaeger_tracer_baggage_truncations_total | Unknown | ins, instance, ip, job, cls |
N/A |
| jaeger_tracer_baggage_updates_total | Unknown | result, ins, instance, ip, job, cls |
N/A |
| jaeger_tracer_finished_spans_total | Unknown | ins, instance, ip, sampled, job, cls |
N/A |
| jaeger_tracer_reporter_queue_length | gauge | ins, instance, ip, job, cls |
Current number of spans in the reporter queue |
| jaeger_tracer_reporter_spans_total | Unknown | result, ins, instance, ip, job, cls |
N/A |
| jaeger_tracer_sampler_queries_total | Unknown | result, ins, instance, ip, job, cls |
N/A |
| jaeger_tracer_sampler_updates_total | Unknown | result, ins, instance, ip, job, cls |
N/A |
| jaeger_tracer_span_context_decoding_errors_total | Unknown | ins, instance, ip, job, cls |
N/A |
| jaeger_tracer_started_spans_total | Unknown | ins, instance, ip, sampled, job, cls |
N/A |
| jaeger_tracer_throttled_debug_spans_total | Unknown | ins, instance, ip, job, cls |
N/A |
| jaeger_tracer_throttler_updates_total | Unknown | result, ins, instance, ip, job, cls |
N/A |
| jaeger_tracer_traces_total | Unknown | ins, instance, ip, sampled, job, cls, state |
N/A |
| kv_request_duration_seconds_bucket | Unknown | ins, instance, role, ip, le, kv_name, type, operation, job, cls, status_code |
N/A |
| kv_request_duration_seconds_count | Unknown | ins, instance, role, ip, kv_name, type, operation, job, cls, status_code |
N/A |
| kv_request_duration_seconds_sum | Unknown | ins, instance, role, ip, kv_name, type, operation, job, cls, status_code |
N/A |
| legacy_grafana_alerting_ticker_interval_seconds | gauge | ins, instance, ip, job, cls |
Interval at which the ticker is meant to tick. |
| legacy_grafana_alerting_ticker_last_consumed_tick_timestamp_seconds | gauge | ins, instance, ip, job, cls |
Timestamp of the last consumed tick in seconds. |
| legacy_grafana_alerting_ticker_next_tick_timestamp_seconds | gauge | ins, instance, ip, job, cls |
Timestamp of the next tick in seconds before it is consumed. |
| logql_query_duration_seconds_bucket | Unknown | ins, instance, query_type, ip, le, job, cls |
N/A |
| logql_query_duration_seconds_count | Unknown | ins, instance, query_type, ip, job, cls |
N/A |
| logql_query_duration_seconds_sum | Unknown | ins, instance, query_type, ip, job, cls |
N/A |
| loki_azure_blob_egress_bytes_total | Unknown | ins, instance, ip, job, cls |
N/A |
| loki_boltdb_shipper_apply_retention_last_successful_run_timestamp_seconds | gauge | ins, instance, ip, job, cls |
Unix timestamp of the last successful retention run |
| loki_boltdb_shipper_compact_tables_operation_duration_seconds | gauge | ins, instance, ip, job, cls |
Time (in seconds) spent in compacting all the tables |
| loki_boltdb_shipper_compact_tables_operation_last_successful_run_timestamp_seconds | gauge | ins, instance, ip, job, cls |
Unix timestamp of the last successful compaction run |
| loki_boltdb_shipper_compact_tables_operation_total | Unknown | ins, instance, ip, status, job, cls |
N/A |
| loki_boltdb_shipper_compactor_running | gauge | ins, instance, ip, job, cls |
Value will be 1 if compactor is currently running on this instance |
| loki_boltdb_shipper_open_existing_file_failures_total | Unknown | ins, instance, ip, component, job, cls |
N/A |
| loki_boltdb_shipper_query_time_table_download_duration_seconds | unknown | ins, instance, ip, component, job, cls, table |
Time (in seconds) spent in downloading of files per table at query time |
| loki_boltdb_shipper_request_duration_seconds_bucket | Unknown | ins, instance, ip, le, component, operation, job, cls, status_code |
N/A |
| loki_boltdb_shipper_request_duration_seconds_count | Unknown | ins, instance, ip, component, operation, job, cls, status_code |
N/A |
| loki_boltdb_shipper_request_duration_seconds_sum | Unknown | ins, instance, ip, component, operation, job, cls, status_code |
N/A |
| loki_boltdb_shipper_tables_download_operation_duration_seconds | gauge | ins, instance, ip, component, job, cls |
Time (in seconds) spent in downloading updated files for all the tables |
| loki_boltdb_shipper_tables_sync_operation_total | Unknown | ins, instance, ip, status, component, job, cls |
N/A |
| loki_boltdb_shipper_tables_upload_operation_total | Unknown | ins, instance, ip, status, component, job, cls |
N/A |
| loki_build_info | gauge | revision, version, ins, instance, ip, tags, goarch, goversion, job, cls, branch, goos |
A metric with a constant ‘1’ value labeled by version, revision, branch, goversion from which loki was built, and the goos and goarch for the build. |
| loki_bytes_per_line_bucket | Unknown | ins, instance, ip, le, job, cls |
N/A |
| loki_bytes_per_line_count | Unknown | ins, instance, ip, job, cls |
N/A |
| loki_bytes_per_line_sum | Unknown | ins, instance, ip, job, cls |
N/A |
| loki_cache_corrupt_chunks_total | Unknown | ins, instance, ip, job, cls |
N/A |
| loki_cache_fetched_keys | unknown | ins, instance, ip, job, cls |
Total count of keys requested from cache. |
| loki_cache_hits | unknown | ins, instance, ip, job, cls |
Total count of keys found in cache. |
| loki_cache_request_duration_seconds_bucket | Unknown | ins, instance, method, ip, le, job, cls, status_code |
N/A |
| loki_cache_request_duration_seconds_count | Unknown | ins, instance, method, ip, job, cls, status_code |
N/A |
| loki_cache_request_duration_seconds_sum | Unknown | ins, instance, method, ip, job, cls, status_code |
N/A |
| loki_cache_value_size_bytes_bucket | Unknown | ins, instance, method, ip, le, job, cls |
N/A |
| loki_cache_value_size_bytes_count | Unknown | ins, instance, method, ip, job, cls |
N/A |
| loki_cache_value_size_bytes_sum | Unknown | ins, instance, method, ip, job, cls |
N/A |
| loki_chunk_fetcher_cache_dequeued_total | Unknown | ins, instance, ip, job, cls |
N/A |
| loki_chunk_fetcher_cache_enqueued_total | Unknown | ins, instance, ip, job, cls |
N/A |
| loki_chunk_fetcher_cache_skipped_buffer_full_total | Unknown | ins, instance, ip, job, cls |
N/A |
| loki_chunk_fetcher_fetched_size_bytes_bucket | Unknown | ins, instance, ip, le, source, job, cls |
N/A |
| loki_chunk_fetcher_fetched_size_bytes_count | Unknown | ins, instance, ip, source, job, cls |
N/A |
| loki_chunk_fetcher_fetched_size_bytes_sum | Unknown | ins, instance, ip, source, job, cls |
N/A |
| loki_chunk_store_chunks_per_query_bucket | Unknown | ins, instance, ip, le, job, cls |
N/A |
| loki_chunk_store_chunks_per_query_count | Unknown | ins, instance, ip, job, cls |
N/A |
| loki_chunk_store_chunks_per_query_sum | Unknown | ins, instance, ip, job, cls |
N/A |
| loki_chunk_store_deduped_bytes_total | Unknown | ins, instance, ip, job, cls |
N/A |
| loki_chunk_store_deduped_chunks_total | Unknown | ins, instance, ip, job, cls |
N/A |
| loki_chunk_store_fetched_chunk_bytes_total | Unknown | ins, instance, ip, user, job, cls |
N/A |
| loki_chunk_store_fetched_chunks_total | Unknown | ins, instance, ip, user, job, cls |
N/A |
| loki_chunk_store_index_entries_per_chunk_bucket | Unknown | ins, instance, ip, le, job, cls |
N/A |
| loki_chunk_store_index_entries_per_chunk_count | Unknown | ins, instance, ip, job, cls |
N/A |
| loki_chunk_store_index_entries_per_chunk_sum | Unknown | ins, instance, ip, job, cls |
N/A |
| loki_chunk_store_index_lookups_per_query_bucket | Unknown | ins, instance, ip, le, job, cls |
N/A |
| loki_chunk_store_index_lookups_per_query_count | Unknown | ins, instance, ip, job, cls |
N/A |
| loki_chunk_store_index_lookups_per_query_sum | Unknown | ins, instance, ip, job, cls |
N/A |
| loki_chunk_store_series_post_intersection_per_query_bucket | Unknown | ins, instance, ip, le, job, cls |
N/A |
| loki_chunk_store_series_post_intersection_per_query_count | Unknown | ins, instance, ip, job, cls |
N/A |
| loki_chunk_store_series_post_intersection_per_query_sum | Unknown | ins, instance, ip, job, cls |
N/A |
| loki_chunk_store_series_pre_intersection_per_query_bucket | Unknown | ins, instance, ip, le, job, cls |
N/A |
| loki_chunk_store_series_pre_intersection_per_query_count | Unknown | ins, instance, ip, job, cls |
N/A |
| loki_chunk_store_series_pre_intersection_per_query_sum | Unknown | ins, instance, ip, job, cls |
N/A |
| loki_chunk_store_stored_chunk_bytes_total | Unknown | ins, instance, ip, user, job, cls |
N/A |
| loki_chunk_store_stored_chunks_total | Unknown | ins, instance, ip, user, job, cls |
N/A |
| loki_consul_request_duration_seconds_bucket | Unknown | ins, instance, ip, le, kv_name, operation, job, cls, status_code |
N/A |
| loki_consul_request_duration_seconds_count | Unknown | ins, instance, ip, kv_name, operation, job, cls, status_code |
N/A |
| loki_consul_request_duration_seconds_sum | Unknown | ins, instance, ip, kv_name, operation, job, cls, status_code |
N/A |
| loki_delete_request_lookups_failed_total | Unknown | ins, instance, ip, job, cls |
N/A |
| loki_delete_request_lookups_total | Unknown | ins, instance, ip, job, cls |
N/A |
| loki_discarded_bytes_total | Unknown | ins, instance, ip, reason, job, cls, tenant |
N/A |
| loki_discarded_samples_total | Unknown | ins, instance, ip, reason, job, cls, tenant |
N/A |
| loki_distributor_bytes_received_total | Unknown | ins, instance, retention_hours, ip, job, cls, tenant |
N/A |
| loki_distributor_ingester_appends_total | Unknown | ins, instance, ip, ingester, job, cls |
N/A |
| loki_distributor_lines_received_total | Unknown | ins, instance, ip, job, cls, tenant |
N/A |
| loki_distributor_replication_factor | gauge | ins, instance, ip, job, cls |
The configured replication factor. |
| loki_distributor_structured_metadata_bytes_received_total | Unknown | ins, instance, retention_hours, ip, job, cls, tenant |
N/A |
| loki_experimental_features_in_use_total | Unknown | ins, instance, ip, job, cls |
N/A |
| loki_index_chunk_refs_total | Unknown | ins, instance, ip, status, job, cls |
N/A |
| loki_index_request_duration_seconds_bucket | Unknown | ins, instance, ip, le, component, operation, job, cls, status_code |
N/A |
| loki_index_request_duration_seconds_count | Unknown | ins, instance, ip, component, operation, job, cls, status_code |
N/A |
| loki_index_request_duration_seconds_sum | Unknown | ins, instance, ip, component, operation, job, cls, status_code |
N/A |
| loki_inflight_requests | gauge | ins, instance, method, ip, route, job, cls |
Current number of inflight requests. |
| loki_ingester_autoforget_unhealthy_ingesters_total | Unknown | ins, instance, ip, job, cls |
N/A |
| loki_ingester_blocks_per_chunk_bucket | Unknown | ins, instance, ip, le, job, cls |
N/A |
| loki_ingester_blocks_per_chunk_count | Unknown | ins, instance, ip, job, cls |
N/A |
| loki_ingester_blocks_per_chunk_sum | Unknown | ins, instance, ip, job, cls |
N/A |
| loki_ingester_checkpoint_creations_failed_total | Unknown | ins, instance, ip, job, cls |
N/A |
| loki_ingester_checkpoint_creations_total | Unknown | ins, instance, ip, job, cls |
N/A |
| loki_ingester_checkpoint_deletions_failed_total | Unknown | ins, instance, ip, job, cls |
N/A |
| loki_ingester_checkpoint_deletions_total | Unknown | ins, instance, ip, job, cls |
N/A |
| loki_ingester_checkpoint_duration_seconds | summary | ins, instance, ip, job, cls, quantile |
Time taken to create a checkpoint. |
| loki_ingester_checkpoint_duration_seconds_count | Unknown | ins, instance, ip, job, cls |
N/A |
| loki_ingester_checkpoint_duration_seconds_sum | Unknown | ins, instance, ip, job, cls |
N/A |
| loki_ingester_checkpoint_logged_bytes_total | Unknown | ins, instance, ip, job, cls |
N/A |
| loki_ingester_chunk_age_seconds_bucket | Unknown | ins, instance, ip, le, job, cls |
N/A |
| loki_ingester_chunk_age_seconds_count | Unknown | ins, instance, ip, job, cls |
N/A |
| loki_ingester_chunk_age_seconds_sum | Unknown | ins, instance, ip, job, cls |
N/A |
| loki_ingester_chunk_bounds_hours_bucket | Unknown | ins, instance, ip, le, job, cls |
N/A |
| loki_ingester_chunk_bounds_hours_count | Unknown | ins, instance, ip, job, cls |
N/A |
| loki_ingester_chunk_bounds_hours_sum | Unknown | ins, instance, ip, job, cls |
N/A |
| loki_ingester_chunk_compression_ratio_bucket | Unknown | ins, instance, ip, le, job, cls |
N/A |
| loki_ingester_chunk_compression_ratio_count | Unknown | ins, instance, ip, job, cls |
N/A |
| loki_ingester_chunk_compression_ratio_sum | Unknown | ins, instance, ip, job, cls |
N/A |
| loki_ingester_chunk_encode_time_seconds_bucket | Unknown | ins, instance, ip, le, job, cls |
N/A |
| loki_ingester_chunk_encode_time_seconds_count | Unknown | ins, instance, ip, job, cls |
N/A |
| loki_ingester_chunk_encode_time_seconds_sum | Unknown | ins, instance, ip, job, cls |
N/A |
| loki_ingester_chunk_entries_bucket | Unknown | ins, instance, ip, le, job, cls |
N/A |
| loki_ingester_chunk_entries_count | Unknown | ins, instance, ip, job, cls |
N/A |
| loki_ingester_chunk_entries_sum | Unknown | ins, instance, ip, job, cls |
N/A |
| loki_ingester_chunk_size_bytes_bucket | Unknown | ins, instance, ip, le, job, cls |
N/A |
| loki_ingester_chunk_size_bytes_count | Unknown | ins, instance, ip, job, cls |
N/A |
| loki_ingester_chunk_size_bytes_sum | Unknown | ins, instance, ip, job, cls |
N/A |
| loki_ingester_chunk_stored_bytes_total | Unknown | ins, instance, ip, job, cls, tenant |
N/A |
| loki_ingester_chunk_utilization_bucket | Unknown | ins, instance, ip, le, job, cls |
N/A |
| loki_ingester_chunk_utilization_count | Unknown | ins, instance, ip, job, cls |
N/A |
| loki_ingester_chunk_utilization_sum | Unknown | ins, instance, ip, job, cls |
N/A |
| loki_ingester_chunks_created_total | Unknown | ins, instance, ip, job, cls |
N/A |
| loki_ingester_chunks_flushed_total | Unknown | ins, instance, ip, reason, job, cls |
N/A |
| loki_ingester_chunks_stored_total | Unknown | ins, instance, ip, job, cls, tenant |
N/A |
| loki_ingester_client_request_duration_seconds_bucket | Unknown | ins, instance, ip, le, operation, job, cls, status_code |
N/A |
| loki_ingester_client_request_duration_seconds_count | Unknown | ins, instance, ip, operation, job, cls, status_code |
N/A |
| loki_ingester_client_request_duration_seconds_sum | Unknown | ins, instance, ip, operation, job, cls, status_code |
N/A |
| loki_ingester_limiter_enabled | gauge | ins, instance, ip, job, cls |
Whether the ingester’s limiter is enabled |
| loki_ingester_memory_chunks | gauge | ins, instance, ip, job, cls |
The total number of chunks in memory. |
| loki_ingester_memory_streams | gauge | ins, instance, ip, job, cls, tenant |
The total number of streams in memory per tenant. |
| loki_ingester_memory_streams_labels_bytes | gauge | ins, instance, ip, job, cls |
Total bytes of labels of the streams in memory. |
| loki_ingester_received_chunks | unknown | ins, instance, ip, job, cls |
The total number of chunks received by this ingester whilst joining. |
| loki_ingester_samples_per_chunk_bucket | Unknown | ins, instance, ip, le, job, cls |
N/A |
| loki_ingester_samples_per_chunk_count | Unknown | ins, instance, ip, job, cls |
N/A |
| loki_ingester_samples_per_chunk_sum | Unknown | ins, instance, ip, job, cls |
N/A |
| loki_ingester_sent_chunks | unknown | ins, instance, ip, job, cls |
The total number of chunks sent by this ingester whilst leaving. |
| loki_ingester_shutdown_marker | gauge | ins, instance, ip, job, cls |
1 if prepare shutdown has been called, 0 otherwise |
| loki_ingester_streams_created_total | Unknown | ins, instance, ip, job, cls, tenant |
N/A |
| loki_ingester_streams_removed_total | Unknown | ins, instance, ip, job, cls, tenant |
N/A |
| loki_ingester_wal_bytes_in_use | gauge | ins, instance, ip, job, cls |
Total number of bytes in use by the WAL recovery process. |
| loki_ingester_wal_disk_full_failures_total | Unknown | ins, instance, ip, job, cls |
N/A |
| loki_ingester_wal_duplicate_entries_total | Unknown | ins, instance, ip, job, cls |
N/A |
| loki_ingester_wal_logged_bytes_total | Unknown | ins, instance, ip, job, cls |
N/A |
| loki_ingester_wal_records_logged_total | Unknown | ins, instance, ip, job, cls |
N/A |
| loki_ingester_wal_recovered_bytes_total | Unknown | ins, instance, ip, job, cls |
N/A |
| loki_ingester_wal_recovered_chunks_total | Unknown | ins, instance, ip, job, cls |
N/A |
| loki_ingester_wal_recovered_entries_total | Unknown | ins, instance, ip, job, cls |
N/A |
| loki_ingester_wal_recovered_streams_total | Unknown | ins, instance, ip, job, cls |
N/A |
| loki_ingester_wal_replay_active | gauge | ins, instance, ip, job, cls |
Whether the WAL is replaying |
| loki_ingester_wal_replay_duration_seconds | gauge | ins, instance, ip, job, cls |
Time taken to replay the checkpoint and the WAL. |
| loki_ingester_wal_replay_flushing | gauge | ins, instance, ip, job, cls |
Whether the wal replay is in a flushing phase due to backpressure |
| loki_internal_log_messages_total | Unknown | ins, instance, ip, level, job, cls |
N/A |
| loki_kv_request_duration_seconds_bucket | Unknown | ins, instance, role, ip, le, kv_name, type, operation, job, cls, status_code |
N/A |
| loki_kv_request_duration_seconds_count | Unknown | ins, instance, role, ip, kv_name, type, operation, job, cls, status_code |
N/A |
| loki_kv_request_duration_seconds_sum | Unknown | ins, instance, role, ip, kv_name, type, operation, job, cls, status_code |
N/A |
| loki_log_flushes_bucket | Unknown | ins, instance, ip, le, job, cls |
N/A |
| loki_log_flushes_count | Unknown | ins, instance, ip, job, cls |
N/A |
| loki_log_flushes_sum | Unknown | ins, instance, ip, job, cls |
N/A |
| loki_log_messages_total | Unknown | ins, instance, ip, level, job, cls |
N/A |
| loki_logql_querystats_bytes_processed_per_seconds_bucket | Unknown | ins, instance, range, ip, le, sharded, type, job, cls, status_code, latency_type |
N/A |
| loki_logql_querystats_bytes_processed_per_seconds_count | Unknown | ins, instance, range, ip, sharded, type, job, cls, status_code, latency_type |
N/A |
| loki_logql_querystats_bytes_processed_per_seconds_sum | Unknown | ins, instance, range, ip, sharded, type, job, cls, status_code, latency_type |
N/A |
| loki_logql_querystats_chunk_download_latency_seconds_bucket | Unknown | ins, instance, range, ip, le, type, job, cls, status_code |
N/A |
| loki_logql_querystats_chunk_download_latency_seconds_count | Unknown | ins, instance, range, ip, type, job, cls, status_code |
N/A |
| loki_logql_querystats_chunk_download_latency_seconds_sum | Unknown | ins, instance, range, ip, type, job, cls, status_code |
N/A |
| loki_logql_querystats_downloaded_chunk_total | Unknown | ins, instance, range, ip, type, job, cls, status_code |
N/A |
| loki_logql_querystats_duplicates_total | Unknown | ins, instance, ip, job, cls |
N/A |
| loki_logql_querystats_ingester_sent_lines_total | Unknown | ins, instance, ip, job, cls |
N/A |
| loki_logql_querystats_latency_seconds_bucket | Unknown | ins, instance, range, ip, le, type, job, cls, status_code |
N/A |
| loki_logql_querystats_latency_seconds_count | Unknown | ins, instance, range, ip, type, job, cls, status_code |
N/A |
| loki_logql_querystats_latency_seconds_sum | Unknown | ins, instance, range, ip, type, job, cls, status_code |
N/A |
| loki_panic_total | Unknown | ins, instance, ip, job, cls |
N/A |
| loki_querier_index_cache_corruptions_total | Unknown | ins, instance, ip, job, cls |
N/A |
| loki_querier_index_cache_encode_errors_total | Unknown | ins, instance, ip, job, cls |
N/A |
| loki_querier_index_cache_gets_total | Unknown | ins, instance, ip, job, cls |
N/A |
| loki_querier_index_cache_hits_total | Unknown | ins, instance, ip, job, cls |
N/A |
| loki_querier_index_cache_puts_total | Unknown | ins, instance, ip, job, cls |
N/A |
| loki_querier_query_frontend_clients | gauge | ins, instance, ip, job, cls |
The current number of clients connected to query-frontend. |
| loki_querier_query_frontend_request_duration_seconds_bucket | Unknown | ins, instance, ip, le, operation, job, cls, status_code |
N/A |
| loki_querier_query_frontend_request_duration_seconds_count | Unknown | ins, instance, ip, operation, job, cls, status_code |
N/A |
| loki_querier_query_frontend_request_duration_seconds_sum | Unknown | ins, instance, ip, operation, job, cls, status_code |
N/A |
| loki_querier_tail_active | gauge | ins, instance, ip, job, cls |
Number of active tailers |
| loki_querier_tail_active_streams | gauge | ins, instance, ip, job, cls |
Number of active streams being tailed |
| loki_querier_tail_bytes_total | Unknown | ins, instance, ip, job, cls |
N/A |
| loki_querier_worker_concurrency | gauge | ins, instance, ip, job, cls |
Number of concurrent querier workers |
| loki_querier_worker_inflight_queries | gauge | ins, instance, ip, job, cls |
Number of queries being processed by the querier workers |
| loki_query_frontend_log_result_cache_hit_total | Unknown | ins, instance, ip, job, cls |
N/A |
| loki_query_frontend_log_result_cache_miss_total | Unknown | ins, instance, ip, job, cls |
N/A |
| loki_query_frontend_partitions_bucket | Unknown | ins, instance, ip, le, job, cls |
N/A |
| loki_query_frontend_partitions_count | Unknown | ins, instance, ip, job, cls |
N/A |
| loki_query_frontend_partitions_sum | Unknown | ins, instance, ip, job, cls |
N/A |
| loki_query_frontend_shard_factor_bucket | Unknown | ins, instance, ip, le, mapper, job, cls |
N/A |
| loki_query_frontend_shard_factor_count | Unknown | ins, instance, ip, mapper, job, cls |
N/A |
| loki_query_frontend_shard_factor_sum | Unknown | ins, instance, ip, mapper, job, cls |
N/A |
| loki_query_scheduler_enqueue_count | Unknown | ins, instance, ip, level, user, job, cls |
N/A |
| loki_rate_store_expired_streams_total | Unknown | ins, instance, ip, job, cls |
N/A |
| loki_rate_store_max_stream_rate_bytes | gauge | ins, instance, ip, job, cls |
The maximum stream rate for any stream reported by ingesters during a sync operation. Sharded Streams are combined. |
| loki_rate_store_max_stream_shards | gauge | ins, instance, ip, job, cls |
The number of shards for a single stream reported by ingesters during a sync operation. |
| loki_rate_store_max_unique_stream_rate_bytes | gauge | ins, instance, ip, job, cls |
The maximum stream rate for any stream reported by ingesters during a sync operation. Sharded Streams are considered separate. |
| loki_rate_store_stream_rate_bytes_bucket | Unknown | ins, instance, ip, le, job, cls |
N/A |
| loki_rate_store_stream_rate_bytes_count | Unknown | ins, instance, ip, job, cls |
N/A |
| loki_rate_store_stream_rate_bytes_sum | Unknown | ins, instance, ip, job, cls |
N/A |
| loki_rate_store_stream_shards_bucket | Unknown | ins, instance, ip, le, job, cls |
N/A |
| loki_rate_store_stream_shards_count | Unknown | ins, instance, ip, job, cls |
N/A |
| loki_rate_store_stream_shards_sum | Unknown | ins, instance, ip, job, cls |
N/A |
| loki_rate_store_streams | gauge | ins, instance, ip, job, cls |
The number of unique streams reported by all ingesters. Sharded streams are combined |
| loki_request_duration_seconds_bucket | Unknown | ins, instance, method, ip, le, ws, route, job, cls, status_code |
N/A |
| loki_request_duration_seconds_count | Unknown | ins, instance, method, ip, ws, route, job, cls, status_code |
N/A |
| loki_request_duration_seconds_sum | Unknown | ins, instance, method, ip, ws, route, job, cls, status_code |
N/A |
| loki_request_message_bytes_bucket | Unknown | ins, instance, method, ip, le, route, job, cls |
N/A |
| loki_request_message_bytes_count | Unknown | ins, instance, method, ip, route, job, cls |
N/A |
| loki_request_message_bytes_sum | Unknown | ins, instance, method, ip, route, job, cls |
N/A |
| loki_response_message_bytes_bucket | Unknown | ins, instance, method, ip, le, route, job, cls |
N/A |
| loki_response_message_bytes_count | Unknown | ins, instance, method, ip, route, job, cls |
N/A |
| loki_response_message_bytes_sum | Unknown | ins, instance, method, ip, route, job, cls |
N/A |
| loki_results_cache_version_comparisons_total | Unknown | ins, instance, ip, job, cls |
N/A |
| loki_store_chunks_downloaded_total | Unknown | ins, instance, ip, status, job, cls |
N/A |
| loki_store_chunks_per_batch_bucket | Unknown | ins, instance, ip, le, status, job, cls |
N/A |
| loki_store_chunks_per_batch_count | Unknown | ins, instance, ip, status, job, cls |
N/A |
| loki_store_chunks_per_batch_sum | Unknown | ins, instance, ip, status, job, cls |
N/A |
| loki_store_series_total | Unknown | ins, instance, ip, status, job, cls |
N/A |
| loki_stream_sharding_count | unknown | ins, instance, ip, job, cls |
Total number of times the distributor has sharded streams |
| loki_tcp_connections | gauge | ins, instance, ip, protocol, job, cls |
Current number of accepted TCP connections. |
| loki_tcp_connections_limit | gauge | ins, instance, ip, protocol, job, cls |
The max number of TCP connections that can be accepted (0 means no limit). |
| net_conntrack_dialer_conn_attempted_total | counter | ins, instance, ip, dialer_name, job, cls |
Total number of connections attempted by the given dialer a given name. |
| net_conntrack_dialer_conn_closed_total | counter | ins, instance, ip, dialer_name, job, cls |
Total number of connections closed which originated from the dialer of a given name. |
| net_conntrack_dialer_conn_established_total | counter | ins, instance, ip, dialer_name, job, cls |
Total number of connections successfully established by the given dialer a given name. |
| net_conntrack_dialer_conn_failed_total | counter | ins, instance, ip, dialer_name, reason, job, cls |
Total number of connections failed to dial by the dialer a given name. |
| net_conntrack_listener_conn_accepted_total | counter | ins, instance, ip, listener_name, job, cls |
Total number of connections opened to the listener of a given name. |
| net_conntrack_listener_conn_closed_total | counter | ins, instance, ip, listener_name, job, cls |
Total number of connections closed that were made to the listener of a given name. |
| nginx_connections_accepted | counter | ins, instance, ip, job, cls |
Accepted client connections |
| nginx_connections_active | gauge | ins, instance, ip, job, cls |
Active client connections |
| nginx_connections_handled | counter | ins, instance, ip, job, cls |
Handled client connections |
| nginx_connections_reading | gauge | ins, instance, ip, job, cls |
Connections where NGINX is reading the request header |
| nginx_connections_waiting | gauge | ins, instance, ip, job, cls |
Idle client connections |
| nginx_connections_writing | gauge | ins, instance, ip, job, cls |
Connections where NGINX is writing the response back to the client |
| nginx_exporter_build_info | gauge | revision, version, ins, instance, ip, tags, goarch, goversion, job, cls, branch, goos |
A metric with a constant ‘1’ value labeled by version, revision, branch, goversion from which nginx_exporter was built, and the goos and goarch for the build. |
| nginx_http_requests_total | counter | ins, instance, ip, job, cls |
Total http requests |
| nginx_up | gauge | ins, instance, ip, job, cls |
Status of the last metric scrape |
| plugins_active_instances | gauge | ins, instance, ip, job, cls |
The number of active plugin instances |
| plugins_datasource_instances_total | Unknown | ins, instance, ip, job, cls |
N/A |
| process_cpu_seconds_total | counter | ins, instance, ip, job, cls |
Total user and system CPU time spent in seconds. |
| process_max_fds | gauge | ins, instance, ip, job, cls |
Maximum number of open file descriptors. |
| process_open_fds | gauge | ins, instance, ip, job, cls |
Number of open file descriptors. |
| process_resident_memory_bytes | gauge | ins, instance, ip, job, cls |
Resident memory size in bytes. |
| process_start_time_seconds | gauge | ins, instance, ip, job, cls |
Start time of the process since unix epoch in seconds. |
| process_virtual_memory_bytes | gauge | ins, instance, ip, job, cls |
Virtual memory size in bytes. |
| process_virtual_memory_max_bytes | gauge | ins, instance, ip, job, cls |
Maximum amount of virtual memory available in bytes. |
| prometheus_api_remote_read_queries | gauge | ins, instance, ip, job, cls |
The current number of remote read queries being executed or waiting. |
| prometheus_build_info | gauge | revision, version, ins, instance, ip, tags, goarch, goversion, job, cls, branch, goos |
A metric with a constant ‘1’ value labeled by version, revision, branch, goversion from which prometheus was built, and the goos and goarch for the build. |
| prometheus_config_last_reload_success_timestamp_seconds | gauge | ins, instance, ip, job, cls |
Timestamp of the last successful configuration reload. |
| prometheus_config_last_reload_successful | gauge | ins, instance, ip, job, cls |
Whether the last configuration reload attempt was successful. |
| prometheus_engine_queries | gauge | ins, instance, ip, job, cls |
The current number of queries being executed or waiting. |
| prometheus_engine_queries_concurrent_max | gauge | ins, instance, ip, job, cls |
The max number of concurrent queries. |
| prometheus_engine_query_duration_seconds | summary | ins, instance, ip, job, cls, quantile, slice |
Query timings |
| prometheus_engine_query_duration_seconds_count | Unknown | ins, instance, ip, job, cls, slice |
N/A |
| prometheus_engine_query_duration_seconds_sum | Unknown | ins, instance, ip, job, cls, slice |
N/A |
| prometheus_engine_query_log_enabled | gauge | ins, instance, ip, job, cls |
State of the query log. |
| prometheus_engine_query_log_failures_total | counter | ins, instance, ip, job, cls |
The number of query log failures. |
| prometheus_engine_query_samples_total | counter | ins, instance, ip, job, cls |
The total number of samples loaded by all queries. |
| prometheus_http_request_duration_seconds_bucket | Unknown | ins, instance, ip, le, job, cls, handler |
N/A |
| prometheus_http_request_duration_seconds_count | Unknown | ins, instance, ip, job, cls, handler |
N/A |
| prometheus_http_request_duration_seconds_sum | Unknown | ins, instance, ip, job, cls, handler |
N/A |
| prometheus_http_requests_total | counter | ins, instance, ip, job, cls, code, handler |
Counter of HTTP requests. |
| prometheus_http_response_size_bytes_bucket | Unknown | ins, instance, ip, le, job, cls, handler |
N/A |
| prometheus_http_response_size_bytes_count | Unknown | ins, instance, ip, job, cls, handler |
N/A |
| prometheus_http_response_size_bytes_sum | Unknown | ins, instance, ip, job, cls, handler |
N/A |
| prometheus_notifications_alertmanagers_discovered | gauge | ins, instance, ip, job, cls |
The number of alertmanagers discovered and active. |
| prometheus_notifications_dropped_total | counter | ins, instance, ip, job, cls |
Total number of alerts dropped due to errors when sending to Alertmanager. |
| prometheus_notifications_errors_total | counter | ins, instance, ip, alertmanager, job, cls |
Total number of errors sending alert notifications. |
| prometheus_notifications_latency_seconds | summary | ins, instance, ip, alertmanager, job, cls, quantile |
Latency quantiles for sending alert notifications. |
| prometheus_notifications_latency_seconds_count | Unknown | ins, instance, ip, alertmanager, job, cls |
N/A |
| prometheus_notifications_latency_seconds_sum | Unknown | ins, instance, ip, alertmanager, job, cls |
N/A |
| prometheus_notifications_queue_capacity | gauge | ins, instance, ip, job, cls |
The capacity of the alert notifications queue. |
| prometheus_notifications_queue_length | gauge | ins, instance, ip, job, cls |
The number of alert notifications in the queue. |
| prometheus_notifications_sent_total | counter | ins, instance, ip, alertmanager, job, cls |
Total number of alerts sent. |
| prometheus_ready | gauge | ins, instance, ip, job, cls |
Whether Prometheus startup was fully completed and the server is ready for normal operation. |
| prometheus_remote_storage_exemplars_in_total | counter | ins, instance, ip, job, cls |
Exemplars in to remote storage, compare to exemplars out for queue managers. |
| prometheus_remote_storage_highest_timestamp_in_seconds | gauge | ins, instance, ip, job, cls |
Highest timestamp that has come into the remote storage via the Appender interface, in seconds since epoch. |
| prometheus_remote_storage_histograms_in_total | counter | ins, instance, ip, job, cls |
HistogramSamples in to remote storage, compare to histograms out for queue managers. |
| prometheus_remote_storage_samples_in_total | counter | ins, instance, ip, job, cls |
Samples in to remote storage, compare to samples out for queue managers. |
| prometheus_remote_storage_string_interner_zero_reference_releases_total | counter | ins, instance, ip, job, cls |
The number of times release has been called for strings that are not interned. |
| prometheus_rule_evaluation_duration_seconds | summary | ins, instance, ip, job, cls, quantile |
The duration for a rule to execute. |
| prometheus_rule_evaluation_duration_seconds_count | Unknown | ins, instance, ip, job, cls |
N/A |
| prometheus_rule_evaluation_duration_seconds_sum | Unknown | ins, instance, ip, job, cls |
N/A |
| prometheus_rule_evaluation_failures_total | counter | ins, instance, ip, job, cls, rule_group |
The total number of rule evaluation failures. |
| prometheus_rule_evaluations_total | counter | ins, instance, ip, job, cls, rule_group |
The total number of rule evaluations. |
| prometheus_rule_group_duration_seconds | summary | ins, instance, ip, job, cls, quantile |
The duration of rule group evaluations. |
| prometheus_rule_group_duration_seconds_count | Unknown | ins, instance, ip, job, cls |
N/A |
| prometheus_rule_group_duration_seconds_sum | Unknown | ins, instance, ip, job, cls |
N/A |
| prometheus_rule_group_interval_seconds | gauge | ins, instance, ip, job, cls, rule_group |
The interval of a rule group. |
| prometheus_rule_group_iterations_missed_total | counter | ins, instance, ip, job, cls, rule_group |
The total number of rule group evaluations missed due to slow rule group evaluation. |
| prometheus_rule_group_iterations_total | counter | ins, instance, ip, job, cls, rule_group |
The total number of scheduled rule group evaluations, whether executed or missed. |
| prometheus_rule_group_last_duration_seconds | gauge | ins, instance, ip, job, cls, rule_group |
The duration of the last rule group evaluation. |
| prometheus_rule_group_last_evaluation_samples | gauge | ins, instance, ip, job, cls, rule_group |
The number of samples returned during the last rule group evaluation. |
| prometheus_rule_group_last_evaluation_timestamp_seconds | gauge | ins, instance, ip, job, cls, rule_group |
The timestamp of the last rule group evaluation in seconds. |
| prometheus_rule_group_rules | gauge | ins, instance, ip, job, cls, rule_group |
The number of rules. |
| prometheus_sd_azure_cache_hit_total | counter | ins, instance, ip, job, cls |
Number of cache hit during refresh. |
| prometheus_sd_azure_failures_total | counter | ins, instance, ip, job, cls |
Number of Azure service discovery refresh failures. |
| prometheus_sd_consul_rpc_duration_seconds | summary | endpoint, ins, instance, ip, job, cls, call, quantile |
The duration of a Consul RPC call in seconds. |
| prometheus_sd_consul_rpc_duration_seconds_count | Unknown | endpoint, ins, instance, ip, job, cls, call |
N/A |
| prometheus_sd_consul_rpc_duration_seconds_sum | Unknown | endpoint, ins, instance, ip, job, cls, call |
N/A |
| prometheus_sd_consul_rpc_failures_total | counter | ins, instance, ip, job, cls |
The number of Consul RPC call failures. |
| prometheus_sd_discovered_targets | gauge | ins, instance, ip, config, job, cls |
Current number of discovered targets. |
| prometheus_sd_dns_lookup_failures_total | counter | ins, instance, ip, job, cls |
The number of DNS-SD lookup failures. |
| prometheus_sd_dns_lookups_total | counter | ins, instance, ip, job, cls |
The number of DNS-SD lookups. |
| prometheus_sd_failed_configs | gauge | ins, instance, ip, job, cls |
Current number of service discovery configurations that failed to load. |
| prometheus_sd_file_mtime_seconds | gauge | ins, instance, ip, filename, job, cls |
Timestamp (mtime) of files read by FileSD. Timestamp is set at read time. |
| prometheus_sd_file_read_errors_total | counter | ins, instance, ip, job, cls |
The number of File-SD read errors. |
| prometheus_sd_file_scan_duration_seconds | summary | ins, instance, ip, job, cls, quantile |
The duration of the File-SD scan in seconds. |
| prometheus_sd_file_scan_duration_seconds_count | Unknown | ins, instance, ip, job, cls |
N/A |
| prometheus_sd_file_scan_duration_seconds_sum | Unknown | ins, instance, ip, job, cls |
N/A |
| prometheus_sd_file_watcher_errors_total | counter | ins, instance, ip, job, cls |
The number of File-SD errors caused by filesystem watch failures. |
| prometheus_sd_http_failures_total | counter | ins, instance, ip, job, cls |
Number of HTTP service discovery refresh failures. |
| prometheus_sd_kubernetes_events_total | counter | event, ins, instance, role, ip, job, cls |
The number of Kubernetes events handled. |
| prometheus_sd_kuma_fetch_duration_seconds | summary | ins, instance, ip, job, cls, quantile |
The duration of a Kuma MADS fetch call. |
| prometheus_sd_kuma_fetch_duration_seconds_count | Unknown | ins, instance, ip, job, cls |
N/A |
| prometheus_sd_kuma_fetch_duration_seconds_sum | Unknown | ins, instance, ip, job, cls |
N/A |
| prometheus_sd_kuma_fetch_failures_total | counter | ins, instance, ip, job, cls |
The number of Kuma MADS fetch call failures. |
| prometheus_sd_kuma_fetch_skipped_updates_total | counter | ins, instance, ip, job, cls |
The number of Kuma MADS fetch calls that result in no updates to the targets. |
| prometheus_sd_linode_failures_total | counter | ins, instance, ip, job, cls |
Number of Linode service discovery refresh failures. |
| prometheus_sd_nomad_failures_total | counter | ins, instance, ip, job, cls |
Number of nomad service discovery refresh failures. |
| prometheus_sd_received_updates_total | counter | ins, instance, ip, job, cls |
Total number of update events received from the SD providers. |
| prometheus_sd_updates_total | counter | ins, instance, ip, job, cls |
Total number of update events sent to the SD consumers. |
| prometheus_target_interval_length_seconds | summary | ins, instance, interval, ip, job, cls, quantile |
Actual intervals between scrapes. |
| prometheus_target_interval_length_seconds_count | Unknown | ins, instance, interval, ip, job, cls |
N/A |
| prometheus_target_interval_length_seconds_sum | Unknown | ins, instance, interval, ip, job, cls |
N/A |
| prometheus_target_metadata_cache_bytes | gauge | ins, instance, ip, scrape_job, job, cls |
The number of bytes that are currently used for storing metric metadata in the cache |
| prometheus_target_metadata_cache_entries | gauge | ins, instance, ip, scrape_job, job, cls |
Total number of metric metadata entries in the cache |
| prometheus_target_scrape_pool_exceeded_label_limits_total | counter | ins, instance, ip, job, cls |
Total number of times scrape pools hit the label limits, during sync or config reload. |
| prometheus_target_scrape_pool_exceeded_target_limit_total | counter | ins, instance, ip, job, cls |
Total number of times scrape pools hit the target limit, during sync or config reload. |
| prometheus_target_scrape_pool_reloads_failed_total | counter | ins, instance, ip, job, cls |
Total number of failed scrape pool reloads. |
| prometheus_target_scrape_pool_reloads_total | counter | ins, instance, ip, job, cls |
Total number of scrape pool reloads. |
| prometheus_target_scrape_pool_sync_total | counter | ins, instance, ip, scrape_job, job, cls |
Total number of syncs that were executed on a scrape pool. |
| prometheus_target_scrape_pool_target_limit | gauge | ins, instance, ip, scrape_job, job, cls |
Maximum number of targets allowed in this scrape pool. |
| prometheus_target_scrape_pool_targets | gauge | ins, instance, ip, scrape_job, job, cls |
Current number of targets in this scrape pool. |
| prometheus_target_scrape_pools_failed_total | counter | ins, instance, ip, job, cls |
Total number of scrape pool creations that failed. |
| prometheus_target_scrape_pools_total | counter | ins, instance, ip, job, cls |
Total number of scrape pool creation attempts. |
| prometheus_target_scrapes_cache_flush_forced_total | counter | ins, instance, ip, job, cls |
How many times a scrape cache was flushed due to getting big while scrapes are failing. |
| prometheus_target_scrapes_exceeded_body_size_limit_total | counter | ins, instance, ip, job, cls |
Total number of scrapes that hit the body size limit |
| prometheus_target_scrapes_exceeded_native_histogram_bucket_limit_total | counter | ins, instance, ip, job, cls |
Total number of scrapes that hit the native histogram bucket limit and were rejected. |
| prometheus_target_scrapes_exceeded_sample_limit_total | counter | ins, instance, ip, job, cls |
Total number of scrapes that hit the sample limit and were rejected. |
| prometheus_target_scrapes_exemplar_out_of_order_total | counter | ins, instance, ip, job, cls |
Total number of exemplar rejected due to not being out of the expected order. |
| prometheus_target_scrapes_sample_duplicate_timestamp_total | counter | ins, instance, ip, job, cls |
Total number of samples rejected due to duplicate timestamps but different values. |
| prometheus_target_scrapes_sample_out_of_bounds_total | counter | ins, instance, ip, job, cls |
Total number of samples rejected due to timestamp falling outside of the time bounds. |
| prometheus_target_scrapes_sample_out_of_order_total | counter | ins, instance, ip, job, cls |
Total number of samples rejected due to not being out of the expected order. |
| prometheus_target_sync_failed_total | counter | ins, instance, ip, scrape_job, job, cls |
Total number of target sync failures. |
| prometheus_target_sync_length_seconds | summary | ins, instance, ip, scrape_job, job, cls, quantile |
Actual interval to sync the scrape pool. |
| prometheus_target_sync_length_seconds_count | Unknown | ins, instance, ip, scrape_job, job, cls |
N/A |
| prometheus_target_sync_length_seconds_sum | Unknown | ins, instance, ip, scrape_job, job, cls |
N/A |
| prometheus_template_text_expansion_failures_total | counter | ins, instance, ip, job, cls |
The total number of template text expansion failures. |
| prometheus_template_text_expansions_total | counter | ins, instance, ip, job, cls |
The total number of template text expansions. |
| prometheus_treecache_watcher_goroutines | gauge | ins, instance, ip, job, cls |
The current number of watcher goroutines. |
| prometheus_treecache_zookeeper_failures_total | counter | ins, instance, ip, job, cls |
The total number of ZooKeeper failures. |
| prometheus_tsdb_blocks_loaded | gauge | ins, instance, ip, job, cls |
Number of currently loaded data blocks |
| prometheus_tsdb_checkpoint_creations_failed_total | counter | ins, instance, ip, job, cls |
Total number of checkpoint creations that failed. |
| prometheus_tsdb_checkpoint_creations_total | counter | ins, instance, ip, job, cls |
Total number of checkpoint creations attempted. |
| prometheus_tsdb_checkpoint_deletions_failed_total | counter | ins, instance, ip, job, cls |
Total number of checkpoint deletions that failed. |
| prometheus_tsdb_checkpoint_deletions_total | counter | ins, instance, ip, job, cls |
Total number of checkpoint deletions attempted. |
| prometheus_tsdb_clean_start | gauge | ins, instance, ip, job, cls |
-1: lockfile is disabled. 0: a lockfile from a previous execution was replaced. 1: lockfile creation was clean |
| prometheus_tsdb_compaction_chunk_range_seconds_bucket | Unknown | ins, instance, ip, le, job, cls |
N/A |
| prometheus_tsdb_compaction_chunk_range_seconds_count | Unknown | ins, instance, ip, job, cls |
N/A |
| prometheus_tsdb_compaction_chunk_range_seconds_sum | Unknown | ins, instance, ip, job, cls |
N/A |
| prometheus_tsdb_compaction_chunk_samples_bucket | Unknown | ins, instance, ip, le, job, cls |
N/A |
| prometheus_tsdb_compaction_chunk_samples_count | Unknown | ins, instance, ip, job, cls |
N/A |
| prometheus_tsdb_compaction_chunk_samples_sum | Unknown | ins, instance, ip, job, cls |
N/A |
| prometheus_tsdb_compaction_chunk_size_bytes_bucket | Unknown | ins, instance, ip, le, job, cls |
N/A |
| prometheus_tsdb_compaction_chunk_size_bytes_count | Unknown | ins, instance, ip, job, cls |
N/A |
| prometheus_tsdb_compaction_chunk_size_bytes_sum | Unknown | ins, instance, ip, job, cls |
N/A |
| prometheus_tsdb_compaction_duration_seconds_bucket | Unknown | ins, instance, ip, le, job, cls |
N/A |
| prometheus_tsdb_compaction_duration_seconds_count | Unknown | ins, instance, ip, job, cls |
N/A |
| prometheus_tsdb_compaction_duration_seconds_sum | Unknown | ins, instance, ip, job, cls |
N/A |
| prometheus_tsdb_compaction_populating_block | gauge | ins, instance, ip, job, cls |
Set to 1 when a block is currently being written to the disk. |
| prometheus_tsdb_compactions_failed_total | counter | ins, instance, ip, job, cls |
Total number of compactions that failed for the partition. |
| prometheus_tsdb_compactions_skipped_total | counter | ins, instance, ip, job, cls |
Total number of skipped compactions due to disabled auto compaction. |
| prometheus_tsdb_compactions_total | counter | ins, instance, ip, job, cls |
Total number of compactions that were executed for the partition. |
| prometheus_tsdb_compactions_triggered_total | counter | ins, instance, ip, job, cls |
Total number of triggered compactions for the partition. |
| prometheus_tsdb_data_replay_duration_seconds | gauge | ins, instance, ip, job, cls |
Time taken to replay the data on disk. |
| prometheus_tsdb_exemplar_exemplars_appended_total | counter | ins, instance, ip, job, cls |
Total number of appended exemplars. |
| prometheus_tsdb_exemplar_exemplars_in_storage | gauge | ins, instance, ip, job, cls |
Number of exemplars currently in circular storage. |
| prometheus_tsdb_exemplar_last_exemplars_timestamp_seconds | gauge | ins, instance, ip, job, cls |
The timestamp of the oldest exemplar stored in circular storage. Useful to check for what timerange the current exemplar buffer limit allows. This usually means the last timestampfor all exemplars for a typical setup. This is not true though if one of the series timestamp is in future compared to rest series. |
| prometheus_tsdb_exemplar_max_exemplars | gauge | ins, instance, ip, job, cls |
Total number of exemplars the exemplar storage can store, resizeable. |
| prometheus_tsdb_exemplar_out_of_order_exemplars_total | counter | ins, instance, ip, job, cls |
Total number of out of order exemplar ingestion failed attempts. |
| prometheus_tsdb_exemplar_series_with_exemplars_in_storage | gauge | ins, instance, ip, job, cls |
Number of series with exemplars currently in circular storage. |
| prometheus_tsdb_head_active_appenders | gauge | ins, instance, ip, job, cls |
Number of currently active appender transactions |
| prometheus_tsdb_head_chunks | gauge | ins, instance, ip, job, cls |
Total number of chunks in the head block. |
| prometheus_tsdb_head_chunks_created_total | counter | ins, instance, ip, job, cls |
Total number of chunks created in the head |
| prometheus_tsdb_head_chunks_removed_total | counter | ins, instance, ip, job, cls |
Total number of chunks removed in the head |
| prometheus_tsdb_head_chunks_storage_size_bytes | gauge | ins, instance, ip, job, cls |
Size of the chunks_head directory. |
| prometheus_tsdb_head_gc_duration_seconds_count | Unknown | ins, instance, ip, job, cls |
N/A |
| prometheus_tsdb_head_gc_duration_seconds_sum | Unknown | ins, instance, ip, job, cls |
N/A |
| prometheus_tsdb_head_max_time | gauge | ins, instance, ip, job, cls |
Maximum timestamp of the head block. The unit is decided by the library consumer. |
| prometheus_tsdb_head_max_time_seconds | gauge | ins, instance, ip, job, cls |
Maximum timestamp of the head block. |
| prometheus_tsdb_head_min_time | gauge | ins, instance, ip, job, cls |
Minimum time bound of the head block. The unit is decided by the library consumer. |
| prometheus_tsdb_head_min_time_seconds | gauge | ins, instance, ip, job, cls |
Minimum time bound of the head block. |
| prometheus_tsdb_head_out_of_order_samples_appended_total | counter | ins, instance, ip, job, cls |
Total number of appended out of order samples. |
| prometheus_tsdb_head_samples_appended_total | counter | ins, instance, ip, type, job, cls |
Total number of appended samples. |
| prometheus_tsdb_head_series | gauge | ins, instance, ip, job, cls |
Total number of series in the head block. |
| prometheus_tsdb_head_series_created_total | counter | ins, instance, ip, job, cls |
Total number of series created in the head |
| prometheus_tsdb_head_series_not_found_total | counter | ins, instance, ip, job, cls |
Total number of requests for series that were not found. |
| prometheus_tsdb_head_series_removed_total | counter | ins, instance, ip, job, cls |
Total number of series removed in the head |
| prometheus_tsdb_head_truncations_failed_total | counter | ins, instance, ip, job, cls |
Total number of head truncations that failed. |
| prometheus_tsdb_head_truncations_total | counter | ins, instance, ip, job, cls |
Total number of head truncations attempted. |
| prometheus_tsdb_isolation_high_watermark | gauge | ins, instance, ip, job, cls |
The highest TSDB append ID that has been given out. |
| prometheus_tsdb_isolation_low_watermark | gauge | ins, instance, ip, job, cls |
The lowest TSDB append ID that is still referenced. |
| prometheus_tsdb_lowest_timestamp | gauge | ins, instance, ip, job, cls |
Lowest timestamp value stored in the database. The unit is decided by the library consumer. |
| prometheus_tsdb_lowest_timestamp_seconds | gauge | ins, instance, ip, job, cls |
Lowest timestamp value stored in the database. |
| prometheus_tsdb_mmap_chunk_corruptions_total | counter | ins, instance, ip, job, cls |
Total number of memory-mapped chunk corruptions. |
| prometheus_tsdb_mmap_chunks_total | counter | ins, instance, ip, job, cls |
Total number of chunks that were memory-mapped. |
| prometheus_tsdb_out_of_bound_samples_total | counter | ins, instance, ip, type, job, cls |
Total number of out of bound samples ingestion failed attempts with out of order support disabled. |
| prometheus_tsdb_out_of_order_samples_total | counter | ins, instance, ip, type, job, cls |
Total number of out of order samples ingestion failed attempts due to out of order being disabled. |
| prometheus_tsdb_reloads_failures_total | counter | ins, instance, ip, job, cls |
Number of times the database failed to reloadBlocks block data from disk. |
| prometheus_tsdb_reloads_total | counter | ins, instance, ip, job, cls |
Number of times the database reloaded block data from disk. |
| prometheus_tsdb_retention_limit_bytes | gauge | ins, instance, ip, job, cls |
Max number of bytes to be retained in the tsdb blocks, configured 0 means disabled |
| prometheus_tsdb_retention_limit_seconds | gauge | ins, instance, ip, job, cls |
How long to retain samples in storage. |
| prometheus_tsdb_size_retentions_total | counter | ins, instance, ip, job, cls |
The number of times that blocks were deleted because the maximum number of bytes was exceeded. |
| prometheus_tsdb_snapshot_replay_error_total | counter | ins, instance, ip, job, cls |
Total number snapshot replays that failed. |
| prometheus_tsdb_storage_blocks_bytes | gauge | ins, instance, ip, job, cls |
The number of bytes that are currently used for local storage by all blocks. |
| prometheus_tsdb_symbol_table_size_bytes | gauge | ins, instance, ip, job, cls |
Size of symbol table in memory for loaded blocks |
| prometheus_tsdb_time_retentions_total | counter | ins, instance, ip, job, cls |
The number of times that blocks were deleted because the maximum time limit was exceeded. |
| prometheus_tsdb_tombstone_cleanup_seconds_bucket | Unknown | ins, instance, ip, le, job, cls |
N/A |
| prometheus_tsdb_tombstone_cleanup_seconds_count | Unknown | ins, instance, ip, job, cls |
N/A |
| prometheus_tsdb_tombstone_cleanup_seconds_sum | Unknown | ins, instance, ip, job, cls |
N/A |
| prometheus_tsdb_too_old_samples_total | counter | ins, instance, ip, type, job, cls |
Total number of out of order samples ingestion failed attempts with out of support enabled, but sample outside of time window. |
| prometheus_tsdb_vertical_compactions_total | counter | ins, instance, ip, job, cls |
Total number of compactions done on overlapping blocks. |
| prometheus_tsdb_wal_completed_pages_total | counter | ins, instance, ip, job, cls |
Total number of completed pages. |
| prometheus_tsdb_wal_corruptions_total | counter | ins, instance, ip, job, cls |
Total number of WAL corruptions. |
| prometheus_tsdb_wal_fsync_duration_seconds | summary | ins, instance, ip, job, cls, quantile |
Duration of write log fsync. |
| prometheus_tsdb_wal_fsync_duration_seconds_count | Unknown | ins, instance, ip, job, cls |
N/A |
| prometheus_tsdb_wal_fsync_duration_seconds_sum | Unknown | ins, instance, ip, job, cls |
N/A |
| prometheus_tsdb_wal_page_flushes_total | counter | ins, instance, ip, job, cls |
Total number of page flushes. |
| prometheus_tsdb_wal_segment_current | gauge | ins, instance, ip, job, cls |
Write log segment index that TSDB is currently writing to. |
| prometheus_tsdb_wal_storage_size_bytes | gauge | ins, instance, ip, job, cls |
Size of the write log directory. |
| prometheus_tsdb_wal_truncate_duration_seconds_count | Unknown | ins, instance, ip, job, cls |
N/A |
| prometheus_tsdb_wal_truncate_duration_seconds_sum | Unknown | ins, instance, ip, job, cls |
N/A |
| prometheus_tsdb_wal_truncations_failed_total | counter | ins, instance, ip, job, cls |
Total number of write log truncations that failed. |
| prometheus_tsdb_wal_truncations_total | counter | ins, instance, ip, job, cls |
Total number of write log truncations attempted. |
| prometheus_tsdb_wal_writes_failed_total | counter | ins, instance, ip, job, cls |
Total number of write log writes that failed. |
| prometheus_web_federation_errors_total | counter | ins, instance, ip, job, cls |
Total number of errors that occurred while sending federation responses. |
| prometheus_web_federation_warnings_total | counter | ins, instance, ip, job, cls |
Total number of warnings that occurred while sending federation responses. |
| promhttp_metric_handler_requests_in_flight | gauge | ins, instance, ip, job, cls |
Current number of scrapes being served. |
| promhttp_metric_handler_requests_total | counter | ins, instance, ip, job, cls, code |
Total number of scrapes by HTTP status code. |
| pushgateway_build_info | gauge | revision, version, ins, instance, ip, tags, goarch, goversion, job, cls, branch, goos |
A metric with a constant ‘1’ value labeled by version, revision, branch, goversion from which pushgateway was built, and the goos and goarch for the build. |
| pushgateway_http_requests_total | counter | ins, instance, method, ip, job, cls, code, handler |
Total HTTP requests processed by the Pushgateway, excluding scrapes. |
| querier_cache_added_new_total | Unknown | ins, instance, ip, job, cache, cls |
N/A |
| querier_cache_added_total | Unknown | ins, instance, ip, job, cache, cls |
N/A |
| querier_cache_entries | gauge | ins, instance, ip, job, cache, cls |
The total number of entries |
| querier_cache_evicted_total | Unknown | ins, instance, ip, job, reason, cache, cls |
N/A |
| querier_cache_gets_total | Unknown | ins, instance, ip, job, cache, cls |
N/A |
| querier_cache_memory_bytes | gauge | ins, instance, ip, job, cache, cls |
The current cache size in bytes |
| querier_cache_misses_total | Unknown | ins, instance, ip, job, cache, cls |
N/A |
| querier_cache_stale_gets_total | Unknown | ins, instance, ip, job, cache, cls |
N/A |
| ring_member_heartbeats_total | Unknown | ins, instance, ip, job, cls |
N/A |
| ring_member_tokens_owned | gauge | ins, instance, ip, job, cls |
The number of tokens owned in the ring. |
| ring_member_tokens_to_own | gauge | ins, instance, ip, job, cls |
The number of tokens to own in the ring. |
| scrape_duration_seconds | Unknown | ins, instance, ip, job, cls |
N/A |
| scrape_samples_post_metric_relabeling | Unknown | ins, instance, ip, job, cls |
N/A |
| scrape_samples_scraped | Unknown | ins, instance, ip, job, cls |
N/A |
| scrape_series_added | Unknown | ins, instance, ip, job, cls |
N/A |
| up | Unknown | ins, instance, ip, job, cls |
N/A |
PING 指标
PING 任务包含有 54 类可用监控指标,由 blackbox_epxorter 提供。
| Metric Name | Type | Labels | Description |
|---|---|---|---|
| agent_up | Unknown | ins, ip, job, instance, cls |
N/A |
| probe_dns_lookup_time_seconds | gauge | ins, ip, job, instance, cls |
Returns the time taken for probe dns lookup in seconds |
| probe_duration_seconds | gauge | ins, ip, job, instance, cls |
Returns how long the probe took to complete in seconds |
| probe_icmp_duration_seconds | gauge | ins, ip, job, phase, instance, cls |
Duration of icmp request by phase |
| probe_icmp_reply_hop_limit | gauge | ins, ip, job, instance, cls |
Replied packet hop limit (TTL for ipv4) |
| probe_ip_addr_hash | gauge | ins, ip, job, instance, cls |
Specifies the hash of IP address. It’s useful to detect if the IP address changes. |
| probe_ip_protocol | gauge | ins, ip, job, instance, cls |
Specifies whether probe ip protocol is IP4 or IP6 |
| probe_success | gauge | ins, ip, job, instance, cls |
Displays whether or not the probe was a success |
| scrape_duration_seconds | Unknown | ins, ip, job, instance, cls |
N/A |
| scrape_samples_post_metric_relabeling | Unknown | ins, ip, job, instance, cls |
N/A |
| scrape_samples_scraped | Unknown | ins, ip, job, instance, cls |
N/A |
| scrape_series_added | Unknown | ins, ip, job, instance, cls |
N/A |
| up | Unknown | ins, ip, job, instance, cls |
N/A |
PUSH 指标
PushGateway 提供 44 类监控指标。
| Metric Name | Type | Labels | Description |
|---|---|---|---|
| agent_up | Unknown | job, cls, instance, ins, ip |
N/A |
| go_gc_duration_seconds | summary | job, cls, instance, ins, quantile, ip |
A summary of the pause duration of garbage collection cycles. |
| go_gc_duration_seconds_count | Unknown | job, cls, instance, ins, ip |
N/A |
| go_gc_duration_seconds_sum | Unknown | job, cls, instance, ins, ip |
N/A |
| go_goroutines | gauge | job, cls, instance, ins, ip |
Number of goroutines that currently exist. |
| go_info | gauge | job, cls, instance, ins, ip, version |
Information about the Go environment. |
| go_memstats_alloc_bytes | counter | job, cls, instance, ins, ip |
Total number of bytes allocated, even if freed. |
| go_memstats_alloc_bytes_total | counter | job, cls, instance, ins, ip |
Total number of bytes allocated, even if freed. |
| go_memstats_buck_hash_sys_bytes | gauge | job, cls, instance, ins, ip |
Number of bytes used by the profiling bucket hash table. |
| go_memstats_frees_total | counter | job, cls, instance, ins, ip |
Total number of frees. |
| go_memstats_gc_sys_bytes | gauge | job, cls, instance, ins, ip |
Number of bytes used for garbage collection system metadata. |
| go_memstats_heap_alloc_bytes | gauge | job, cls, instance, ins, ip |
Number of heap bytes allocated and still in use. |
| go_memstats_heap_idle_bytes | gauge | job, cls, instance, ins, ip |
Number of heap bytes waiting to be used. |
| go_memstats_heap_inuse_bytes | gauge | job, cls, instance, ins, ip |
Number of heap bytes that are in use. |
| go_memstats_heap_objects | gauge | job, cls, instance, ins, ip |
Number of allocated objects. |
| go_memstats_heap_released_bytes | gauge | job, cls, instance, ins, ip |
Number of heap bytes released to OS. |
| go_memstats_heap_sys_bytes | gauge | job, cls, instance, ins, ip |
Number of heap bytes obtained from system. |
| go_memstats_last_gc_time_seconds | gauge | job, cls, instance, ins, ip |
Number of seconds since 1970 of last garbage collection. |
| go_memstats_lookups_total | counter | job, cls, instance, ins, ip |
Total number of pointer lookups. |
| go_memstats_mallocs_total | counter | job, cls, instance, ins, ip |
Total number of mallocs. |
| go_memstats_mcache_inuse_bytes | gauge | job, cls, instance, ins, ip |
Number of bytes in use by mcache structures. |
| go_memstats_mcache_sys_bytes | gauge | job, cls, instance, ins, ip |
Number of bytes used for mcache structures obtained from system. |
| go_memstats_mspan_inuse_bytes | gauge | job, cls, instance, ins, ip |
Number of bytes in use by mspan structures. |
| go_memstats_mspan_sys_bytes | gauge | job, cls, instance, ins, ip |
Number of bytes used for mspan structures obtained from system. |
| go_memstats_next_gc_bytes | gauge | job, cls, instance, ins, ip |
Number of heap bytes when next garbage collection will take place. |
| go_memstats_other_sys_bytes | gauge | job, cls, instance, ins, ip |
Number of bytes used for other system allocations. |
| go_memstats_stack_inuse_bytes | gauge | job, cls, instance, ins, ip |
Number of bytes in use by the stack allocator. |
| go_memstats_stack_sys_bytes | gauge | job, cls, instance, ins, ip |
Number of bytes obtained from system for stack allocator. |
| go_memstats_sys_bytes | gauge | job, cls, instance, ins, ip |
Number of bytes obtained from system. |
| go_threads | gauge | job, cls, instance, ins, ip |
Number of OS threads created. |
| process_cpu_seconds_total | counter | job, cls, instance, ins, ip |
Total user and system CPU time spent in seconds. |
| process_max_fds | gauge | job, cls, instance, ins, ip |
Maximum number of open file descriptors. |
| process_open_fds | gauge | job, cls, instance, ins, ip |
Number of open file descriptors. |
| process_resident_memory_bytes | gauge | job, cls, instance, ins, ip |
Resident memory size in bytes. |
| process_start_time_seconds | gauge | job, cls, instance, ins, ip |
Start time of the process since unix epoch in seconds. |
| process_virtual_memory_bytes | gauge | job, cls, instance, ins, ip |
Virtual memory size in bytes. |
| process_virtual_memory_max_bytes | gauge | job, cls, instance, ins, ip |
Maximum amount of virtual memory available in bytes. |
| pushgateway_build_info | gauge | job, goversion, cls, branch, instance, tags, revision, goarch, ins, ip, version, goos |
A metric with a constant ‘1’ value labeled by version, revision, branch, goversion from which pushgateway was built, and the goos and goarch for the build. |
| pushgateway_http_requests_total | counter | job, cls, method, code, handler, instance, ins, ip |
Total HTTP requests processed by the Pushgateway, excluding scrapes. |
| scrape_duration_seconds | Unknown | job, cls, instance, ins, ip |
N/A |
| scrape_samples_post_metric_relabeling | Unknown | job, cls, instance, ins, ip |
N/A |
| scrape_samples_scraped | Unknown | job, cls, instance, ins, ip |
N/A |
| scrape_series_added | Unknown | job, cls, instance, ins, ip |
N/A |
| up | Unknown | job, cls, instance, ins, ip |
N/A |
8 - 常见问题
INFRA模块中包含了哪些组件?
- Ansible 用于自动化、部署和管理;
- Nginx 用于公开对外暴露各种 WebUI 服务,并为提供一个本地软件源
- 自签名 CA 用于 SSL/TLS 证书;
- Prometheus 用于收集存储监控指标;
- Grafana 用于监控/可视化;
- Loki 用于收集存储查询日志;
- AlertManager 用于告警聚合;
- Chronyd 用于 NTP 时间同步;
- DNSMasq 用于 DNS 注册和解析;
- 在管理节点上的 PostgreSQL 作为 CMDB;(可选)
- Docker 用于无状态的应用程序和工具(可选)。
如何重新向 Prometheus 注册监控目标?
如果你不小心删除了基础设施节点上 Prometheus 的目标目录(/etc/prometheus/target),你可以使用以下命令再次向 Prometheus 注册监控目标:
./infra.yml -t register_prometheus  # 在 infra 节点上向 prometheus 注册所有 infra 目标
./node.yml  -t register_prometheus  # 在 infra 节点上向 prometheus 注册所有 node  目标
./etcd.yml  -t register_prometheus  # 在 infra 节点上向 prometheus 注册所有 etcd  目标
./minio.yml -t register_prometheus  # 在 infra 节点上向 prometheus 注册所有 minio 目标
./pgsql.yml -t register_prometheus  # 在 infra 节点上向 prometheus 注册所有 pgsql 目标
如何重新向 Grafana 注册 PostgreSQL 数据源?
在 pg_databases 中定义的 PGSQL 数据库默认会被注册为 Grafana 数据源(以供 PGCAT 应用使用)。
如果你不小心删除了在 Grafana 中注册的 postgres 数据源,你可以使用以下命令再次注册它们:
# 将所有(在 pg_databases 中定义的) pgsql 数据库注册为 grafana 数据源
./pgsql.yml -t register_grafana
如何重新向 Nginx 注册节点的 Haproxy 管控界面?
如果你不小心删除了 /etc/nginx/conf.d/haproxy 中的已注册 haproxy 代理设置,你可以使用以下命令再次恢复它们:
./node.yml -t register_nginx # 在 infra 节点上向 nginx 注册所有 haproxy 管理页面的代理设置
如何恢复 DNSMASQ 中的域名注册记录?
PGSQL 集群/实例域名默认注册到 infra 节点的 /etc/hosts.d/<name>。你可以使用以下命令再次恢复它们:
./pgsql.yml -t pg_dns # 在 infra 节点上向 dnsmasq 注册 pg 的 DNS 名称
如何使用Nginx对外暴露新的上游服务?
尽管您可以直接通过 IP:Port 的方式访问服务,但我们依然建议收敛访问入口,使用域名并统一从 Nginx 代理访问各类带有 Web 界面的服务。 这样有利于统一收口访问,减少暴露的端口,便于进行访问控制与审计。
如果你希望通过 Nginx 门户公开新的 WebUI 服务,你可以将服务定义添加到 infra_portal 参数中。
例如,下面是 Pigsty 官方 Demo 使用的 Infra 门户配置,对外暴露了几种额外的服务:
infra_portal:
  home         : { domain: home.pigsty.cc }
  grafana      : { domain: demo.pigsty.cc ,endpoint: "${admin_ip}:3000" ,websocket: true }
  prometheus   : { domain: p.pigsty.cc ,endpoint: "${admin_ip}:9090" }
  alertmanager : { domain: a.pigsty.cc ,endpoint: "${admin_ip}:9093" }
  blackbox     : { endpoint: "${admin_ip}:9115" }
  loki         : { endpoint: "${admin_ip}:3100" }
  # 新增的 Web 门户
  minio        : { domain: sss.pigsty  ,endpoint: "${admin_ip}:9001" ,scheme: https ,websocket: true }
  postgrest    : { domain: api.pigsty.cc  ,endpoint: "127.0.0.1:8884"   }
  pgadmin      : { domain: adm.pigsty.cc  ,endpoint: "127.0.0.1:8885"   }
  pgweb        : { domain: cli.pigsty.cc  ,endpoint: "127.0.0.1:8886"   }
  bytebase     : { domain: ddl.pigsty.cc  ,endpoint: "127.0.0.1:8887"   }
  gitea        : { domain: git.pigsty.cc  ,endpoint: "127.0.0.1:8889"   }
  wiki         : { domain: wiki.pigsty.cc ,endpoint: "127.0.0.1:9002"   }
  noco         : { domain: noco.pigsty.cc ,endpoint: "127.0.0.1:9003"   }
  supa         : { domain: supa.pigsty.cc ,endpoint: "127.0.0.1:8000", websocket: true }
完成 Nginx 上游服务定义后,使用以下配置与命令,向 Nginx 注册新的服务。
./infra.yml -t nginx_config           # 重新生成 Nginx 配置文件
./infra.yml -t nginx_launch           # 更新并应用 Nginx 配置。

# 您也可以使用 Ansible 手工重载 Nginx 配置
ansible infra -b -a 'nginx -s reload'  # 重载Nginx配置
如果你希望通过 HTTPS 访问,你必须删除 files/pki/csr/pigsty.csr 和 files/pki/nginx/pigsty.{key,crt} 以强制重新生成 Nginx SSL/TLS 证书以包括新上游的域名。
如果您希望使用权威机构签发的 SSL 证书,而不是 Pigsty 自签名 CA 颁发的证书,可以将其放置于 /etc/nginx/conf.d/cert/ 目录中并修改相应配置:/etc/nginx/conf.d/<name>.conf。
如何手动向节点添加上游仓库的Repo文件?
Pigsty 有一个内置的包装脚本 bin/repo-add,它将调用 ansible 剧本 node.yml 来将 repo 文件添加到相应的节点。
bin/repo-add <selector> [modules]
bin/repo-add 10.10.10.10           # 为节点 10.10.10.10 添加 node 源
bin/repo-add infra   node,infra    # 为 infra 分组添加 node 和 infra 源
bin/repo-add infra   node,local    # 为 infra 分组添加节点仓库和本地pigsty源
bin/repo-add pg-test node,pgsql    # 为 pg-test 分组添加 node 和 pgsql 源