任务教程
- 1: DNS:使用域名访问 Pigsty 中的 Web 服务
- 2: Nginx:向外代理暴露Web服务
- 3: Certbot:申请公网HTTPS证书
- 4: Docker:启用容器与镜像代理
- 5: 使用 PostgreSQL 作为 Ansible 的配置清单与 CMDB
- 6: 使用 PostgreSQL 作为 Grafana 后端数据库
- 7: 使用 TimescaleDB + Promscale 存储 Prometheus 时序指标数据
- 8: 使用 Keepalived 为 Pigsty 节点集群配置二层 VIP
- 9: 使用 VIP-Manager 为 PostgreSQL 集群配置二层 VIP
- 10: HugePage:为数据库启用大页支持
- 11: Citus:部署原生高可用集群
- 12: 高可用演习:3坏2如何处理
- 13: Restic:文件系统备份恢复
- 14: JuiceFS:分布式文件系统
- 15: 便宜VPS
1 - DNS:使用域名访问 Pigsty 中的 Web 服务
安装完 Pigsty 之后,用户可以通过 IP + Port 的方式访问大部分 Infra组件 提供的 Web 界面。
假设你的节点使用的内网 IP 地址是 10.10.10.10,那么默认情况下:
- http://10.10.10.10:3000 是 Grafana 监控面板(日常使用的主要入口)
- http://10.10.10.10:9090 是 Prometheus 时序数据库控制台
- http://10.10.10.10:9093 是 AlertManager 告警控制台
- http://10.10.10.10 是 Nginx HTTP 服务的入口(默认 80 端口)
对于开发测试来说,IP + 端口无需配置即可使用,非常方便,然而对于更严肃的部署而言,我强烈建议您通过 域名 访问这些服务。
使用域名 有诸多优点,并不需要额外花钱或者引入额外的依赖,只需简单一行配置即可。
接下来,我们会深入展开以下主题:
太长不看
向本机 /etc/hosts (Linux/MacOS) / C:\Windows\System32\drivers\etc\hosts (Windows) 文件中添加以下静态解析记录:
sudo tee -a /etc/hosts <<EOF
10.10.10.10 h.pigsty g.pigsty p.pigsty a.pigsty
EOF
将占位符 IP 地址
10.10.10.10替换为 Pigsty 安装节点的 IP 地址(公网/内网不限,可达即可)。如果你修改了
infra_portal中的默认域名,请将默认域名替换为你自己的域名。
为什么要用域名?
Pigsty 强烈建议 使用域名访问 Web 系统,而不是直接通过 IP+Port 直连的方式,原因如下:
- 域名更容易记忆,使用方便
- 域名更加灵活,可以通过修改解析指向不同地址
- 通过域名访问,可以将所有服务收拢至 Nginx 统一出口,便于管理,审计,减小攻击面。
- 使用域名,可以申请 HTTPS 证书,加密流量,避免信息被窃听,提高安全性。
- 在国内,HTTP 访问未备案的域名,会被运营商劫持到特殊页面,HTTPS 访问证书域名则不会
- 一些无法直连的服务,例如监听 127.0.0.1 地址或者内部 Docker 网段的服务,可以通过 NGINX 代理访问
Pigsty 默认使用 内网静态域名,只需要在您本地服务器添加解析即可,无需在 DNS 供应商处申请真实域名。
如果您的 Pigsty 部署于互联网公网环境,您也可以考虑使用真正的互联网域名,并申请免费的 HTTPS 证书。
域名的工作原理
如果您并不熟悉 HTTP / DNS 协议,以下是一个简短的原理介绍:为什么 Nginx 只使用一个 80 端口(+ HTTPS 443)就可以为多个域名提供服务?
DNS协议
- 当客户端(例如浏览器)要访问 https://a.pigsty.cc 时,首先会通过 DNS 请求来解析 a.pigsty.cc 这个域名对应的 IP 地址。
- 负责解析的,可以是 本地的静态文件,也可以是 内网DNS服务器,或者是互联网上的 公网 DNS 解析。
- DNS 返回的 IP 地址可能是同一台服务器,但对客户端来说,它只需要知道:这个域名解析到哪个 IP 即可。
- 多条域名(例如 a.pigsty.cc、p.pigsty.cc)可以在 DNS 解析时指向同一个 IP,浏览器最终都会把请求发到相同的 IP 地址上。
HTTP协议
- 在浏览器请求 HTTP 资源时(HTTP/1.1 及以上),请求头里会包含一个 Host 字段,内容为请求的域名。
- 这个 Host 字段是用于区分的关键,HTTP/1.1 规范规定,客户端必须包含这个首部。
- 当 Nginx 在 80 端口上收到请求后,会根据请求中的 Host,来匹配对应的服务器,进而决定要返回的站点内容。
- 因此通过 Host 不同取值的区分,Nginx 就可以在同一个端口上为不同域名提供不同的内容。
Pigsty默认域名
Pigsty 默认为四个核心组件配置使用以下四个 内网域名:
| 域名 | 名称 | 端口 | 组件 | 说明 |
|---|---|---|---|---|
h.pigsty |
home |
80/443 | Nginx | 默认服务器,本地软件仓库 |
g.pigsty |
grafana |
3000 | Grafana | Grafana 监控大屏与可视化平台 |
p.pigsty |
prometheus |
9090 | Prometheus | Prometheus 监控时序数据库 |
a.pigsty |
alertmanager |
9093 | AlertManager | 告警聚合/屏蔽/管理/消息发送 |
因为这四个域名不使用任何顶级域,所以你需要 本地静态解析 或 内网动态解析 才可以使用。
这并不是什么复杂的配置,只需要在您的客户端机器上添加一行配置即可。
本地静态解析
假设 Pigsty 安装的内网 IP 地址为 10.10.10.10,那么在您的客户端机器上,添加以下静态解析记录即可:
# Pigsty 核心组件与默认域名
10.10.10.10 h.pigsty g.pigsty p.pigsty a.pigsty
如何添加解析
所谓客户端机器,指的是您在本地需要访问 Pigsty 服务的机器,通常也是你使用浏览器的环境,比如笔记本,台式机,虚拟机。
对于 Linux / MacOS 用户,您可以直接 sudo nano /etc/hosts 来编辑 hosts 文件,添加上述记录。
对于 Windows 用户,您需要使用管理员权限执行 notepad C:\Windows\System32\drivers\etc\hosts 来编辑 hosts 文件,添加上述记录。
添加记录后,您就可以通过这几个域名访问 Pigsty 的 Web 服务了。
解析到其他域名
如果您不喜欢 Pigsty 默认的域名,您也可以将解析记录修改为其他域名,只是务必在安装前相应修改 infra_portal 中的 domain 参数。
例如,您希望使用 *.pigsty.xxx 作为默认域名,那么您需要修改 infra_portal 中的 domain 参数为:
infra_portal:
  home         : { domain: h.pigsty.xxx }
  grafana      : { domain: g.pigsty.xxx ,endpoint: "${admin_ip}:3000" ,websocket: true }
  prometheus   : { domain: p.pigsty.xxx ,endpoint: "${admin_ip}:9090" }
  alertmanager : { domain: a.pigsty.xxx ,endpoint: "${admin_ip}:9093" }
  blackbox     : { endpoint: "${admin_ip}:9115" }
  loki         : { endpoint: "${admin_ip}:3100" }
而相应的解析记录则需要修改为:
10.10.10.10 h.pigsty.xxx g.pigsty.xxx p.pigsty.xxx a.pigsty.xxx
这个域名可以是真的域名,也可以是随便什么你自己喜欢的名字,只要你确保域名可以在 本机,内网,或公网 上被解析到 Pigsty 的 IP 地址即可。
其他解析记录
如果您需要运行其他一系列 Pigsty 扩展工具集,你可以一并添加其他解析记录:
# Pigsty 扩展工具与使用的默认域名
10.10.10.10 adm.pigsty   # pgadmin GUI 管理工具
10.10.10.10 ddl.pigsty   # bytebase 数据库DDL管理工具
10.10.10.10 cli.pigsty   # pig CLI 预留域名
10.10.10.10 api.pigsty   # pigsty API 预留域名
10.10.10.10 lab.pigsty   # jupyterlab 预留域名
10.10.10.10 git.pigsty   # gitea 预留域名
10.10.10.10 wiki.pigsty  # wiki.js 预留域名
10.10.10.10 noco.pigsty  # nocodb 预留域名
10.10.10.10 supa.pigsty  # supabase 预留域名
10.10.10.10 dify.pigsty  # dify 预留域名
10.10.10.10 odoo.pigsty  # odoo 预留域名
10.10.10.10 mm.pigsty    # minio 预留域名
解析到公网地址
如果您的 Pigsty 部署在公网环境,比如云服务器上,那么您 不能 将本地解析记录解析到 内网 IP 地址,而 必须 将其解析到您的 公网 IP 地址。
您的云服务器如果可以访问互联网,那么通常会有两块虚拟网卡,一块连接互联网,一块连接内网,同时分别有对应的公网 IP 地址与内网 IP 地址。
假设您的云服务器公网 IP 地址为 1.2.3.4,内网 VPC 地址为 10.10.10.10,那么您需要将解析记录相应配置为:
# 公网/云服务器部署,请解析至公网 IP 地址!修改记录的前半段即可:
1.2.3.4 h.pigsty g.pigsty p.pigsty a.pigsty
内网动态解析
假如您希望在办公网络中的其他同事也可以通过域名访问 Pigsty 的 Web 服务,那么您可以考虑使用 内网动态解析。
最简单的办法是要求您的网络管理员,为您在内网 DNS 服务器上添加上面的解析记录。
使用内网DNS
假设您的内网 DNS 服务器地址为 192.168.1.1,那么在 Linux 与 MacOS 上,您可以编辑 /etc/resolv.conf 文件,添加以下记录:
nameserver 192.168.1.1
在 Windows 上,通常你需要在 “网络和 Internet 设置” 中找到网络适配器,然后打开 `TCP/IPv4 属性,修改 DNS 配置。
您可以通过以下命令来测试内网 DNS 解析是否生效:
dig h.pigsty @192.168.1.1
使用Pigsty自带的DNS
Pigsty Infra 模块 自带 DNS 解析服务器,您也可以通过 53 端口使用该 DNS 服务器。
但公网部署时请务必注意,中国大陆有特殊国情,通常 不允许 用户在公网服务器上启动 DNS 服务(53 端口)!
本地HTTPS访问
当您在本地通过 HTTP 访问 Pigsty 的 Web 服务时,默认会提示 “不安全”,因为这是明文传输的 HTTP 协议,容易被窃听,篡改,冒充。
在默认情况下,Pigsty 会使用本地自签名的 CA 证书为 Nginx 中所有带域名的服务器签发 “自签名证书”,并使用这些证书为 HTTP 服务启用 SSL。
如果你使用 HTTPS 访问 Pigsty 的 Web 服务,默认会提示 “证书错误”,因为这是 自签名的证书,而非权威机构签发的证书。
你可以选择:
- 不管他,回头接着用 HTTP 甚至是 IP+Port 访问,反正这是内网,怎么方便怎么来。
- 使用 HTTPS 访问,点击 “高级 - 我知道这里的风险,继续访问”
- 使用 Chrome 浏览器,可以在提示不安全的窗口键入
thisisunsafe表示你知道这是“不安全”的自签名证书。 - 使用 HTTPS 访问,并且信任自签名证书,需要将 Pigsty 的 CA 证书添加到您的浏览器或操作系统中。
- 申请一个 CA 证书,并给 Pigsty 使用,这样 Pigsty 签发的证书就都是有效真证书。
- 使用正儿八经的真域名,并申请真正的 HTTPS 证书使用。
通常对于内网访问,如果您需要 HTTPS,又懒得每次跳过安全提醒,可以考虑直接在系统中信任 Pigsty 自动生成的 自签名CA。
对于严肃的生产环境,我们建议使用真正的 公网域名 并使用诸如 certbot 这样的工具申请免费的 HTTPS 证书使用。
信任自签名CA
Pigsty 默认会在初始化时,在 安装节点 本机 Pigsty 源码目录(~/pigsty)中生成一个自签名的 CA,并使用此 CA 签发内网各项服务所需的证书。
如果你想通过 HTTPS 加密访问 Pigsty 提供的 Web 服务,需要将 Pigsty 的 CA 证书分发至客户端电脑的信任证书目录中(或用真的 CA ,很贵!)。
在 Pigsty 纳管的 Linux 节点中,都已经自动完成了对 Pigsty 自签名 CA 的信任,在 Linux 上可以这样信任 Pigsty CA:
rm -rf /etc/pki/ca-trust/source/anchors/ca.crt
ln -s /etc/pki/ca.crt /etc/pki/ca-trust/source/anchors/ca.crt
/bin/update-ca-trust
rm -rf /usr/local/share/ca-certificates/ca.crt
ln -s /etc/pki/ca.crt /usr/local/share/ca-certificates/ca.crt
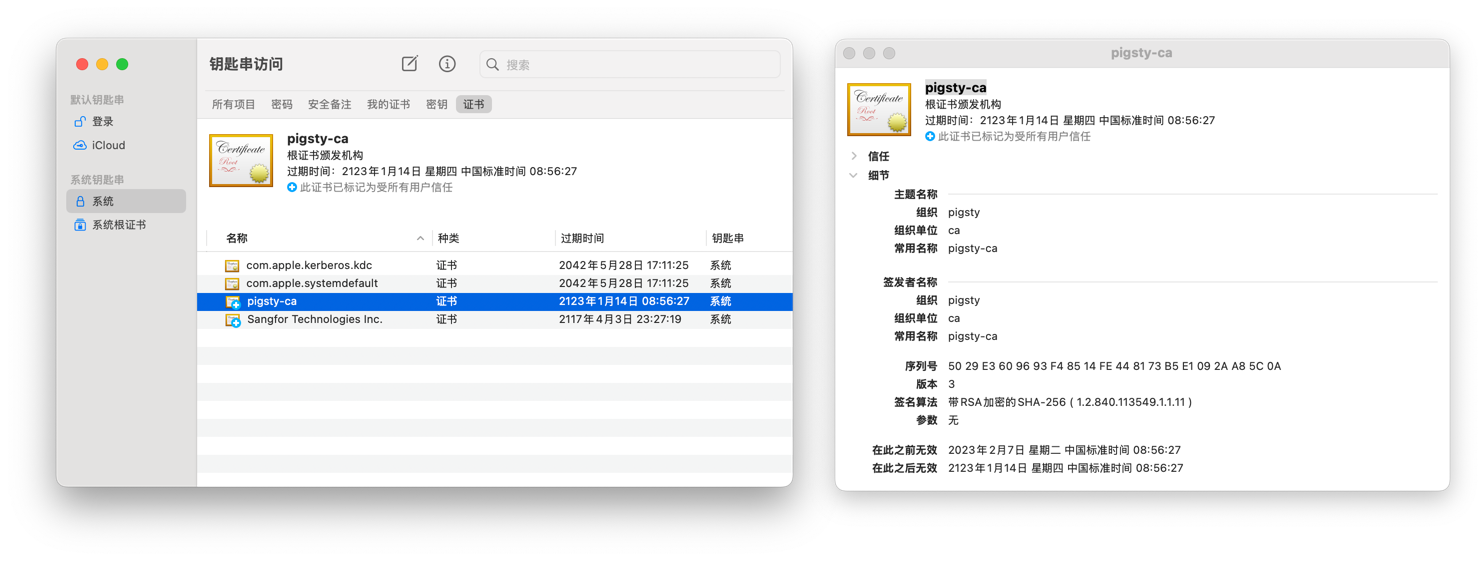
/usr/sbin/update-ca-certificates在 MacOS 上,您需要双击 ca.crt 文件将其加入系统钥匙串,然后在钥匙串应用中,搜索 pigsty-ca ,打开然后选择 “信任” 此根证书。
在 Windows 上,您需要将 ca.crt 文件添加到 “受信任的根证书颁发机构” 中。
信任 Pigsty CA 后,访问由该 CA 签发的自签名证书网站时,就不会再弹出 “不受信任证书” 之类的信息了。
公网域名解析
您也可以使用类似 Cloudflare,Godaddy,阿里云万网,腾讯云 DNSPod 等 DNS 服务商提供的域名解析服务。
这通常需要您 购买 一个域名,普通域名一年十几块钱,很便宜。
通常您需要通过云 DNS 服务商提供的控制台或 API 接口,将域名解析到 Pigsty 部署服务器的 公网 IP 地址。
假设你购买的域名名为 pigsty.xxx,您可以选择添加一条 * 通配符A记录,将所有子域名解析到 Pigsty 部署服务器的 公网 IP 地址。
或者单独为每个组件使用的域名添加一条 A 记录,将其指向 公网IP地址 即可:
- h.pigsty.xxx 1.2.3.4
- a.pigsty.xxx 1.2.3.4
- p.pigsty.xxx 1.2.3.4
- g.pigsty.xxx 1.2.3.4
Pigsty 内置了 Certbot 支持,如果使用公网域名,可以一键申请免费的 HTTPS 证书供 Nginx 使用(需三个月一更新)。
参考阅读
2 - Nginx:向外代理暴露Web服务
Pigsty 的 Infra 模块默认会在节点上安装 Nginx,这是一个高性能的 Web 服务器。 Pigsty 使用 Nginx 作为所有本地 WebUI 服务的统一入口,并将其用作本地软件仓库,向内网其他节点提供服务。
当然,用户可以根据需求,调整配置,将 Nginx 用作标准的 Web 服务器,对外提供服务。 无论是作为反向代理,还是直接作为网站服务器,都可以通过适当的配置实现。 Pigsty 本身的文档站与仓库也是通过 Pigsty 自建的 Nginx 对外提供的。
配置概览
Nginx 服务器配置由 infra_portal 参数指定。
用户在这里声明所有需要通过 Nginx 代理的域名,以及对应的上游服务器端点(endpoint)或本地目录路径(path)。
例如,默认情况下,Pigsty 会这样配置 Nginx,下面的配置会使用 Nginx 对外暴露 Home,Grafana,Prometheus,Alertmanager 四项服务:
infra_portal:  # domain names and upstream servers
  home         : { domain: h.pigsty }
  grafana      : { domain: g.pigsty ,endpoint: "${admin_ip}:3000" , websocket: true }
  prometheus   : { domain: p.pigsty ,endpoint: "${admin_ip}:9090" }
  alertmanager : { domain: a.pigsty ,endpoint: "${admin_ip}:9093" }
  blackbox     : { endpoint: "${admin_ip}:9115" }
  loki         : { endpoint: "${admin_ip}:3100" }
当安装 Pigsty 时,Pigsty 会自动根据以上配置生成 Nginx 的配置文件。
/etc/nginx/conf.d/haproxy/           # <--- 存放着 HAPROXY 管理界面的位置定义
/etc/nginx/conf.d/home.conf          # <--- Pigsty 默认服务器定义(本地软件源,HAPROXY转发)
/etc/nginx/conf.d/grafana.conf       # <--- 代理访问内网 Grafana 服务器
/etc/nginx/conf.d/prometheus.conf    # <--- 代理访问内网 Prometheus 服务器
/etc/nginx/conf.d/alertmanager.conf  # <--- 代理访问内网 Alertmanager 服务器
Nginx 默认服务于 80/443 端口,home 服务器是本地软件源,同时也是默认的 Nginx 服务器。
如果你想通过 Nginx 访问其他服务,只需要在 infra_portal 中添加相应的配置即可,任何带有 domain 参数的配置都会被 Nginx 自动代理。
配置剧本
当安装 Pigsty 时,这些配置会在默认的 install.yml 剧本,或者 infra.yml 剧本中自动生效。
但是用户也可以在 Pigsty 部署后使用 infra.yml 剧本中的 nginx 子任务重新初始化 Nginx 配置。
./infra.yml -t nginx           # 重新配置 Nginx
./infra.yml -t nginx_config    # 重新生成 Nginx 配置
./infra.yml -t nginx_launch    # 重新启动 Nginx 服务
这意味着如果您想要调整 Nginx 服务器的配置,只需要修改 pigsty.yml 配置文件,并执行上面的 nginx 任务即可生效。
当然,你也可以选择先使用 nginx_config 子任务重新生成 Nginx 配置文件,人工检查后使用 nginx -s reload 重新在线加载配置。
配置详情
配置变量 infra_portal 通常定义在全局变量 all.vars 中,默认值如下所示:
all:
  vars:
    infra_portal:  # domain names and upstream servers
      home         : { domain: h.pigsty }
      grafana      : { domain: g.pigsty ,endpoint: "${admin_ip}:3000" , websocket: true }
      prometheus   : { domain: p.pigsty ,endpoint: "${admin_ip}:9090" }
      alertmanager : { domain: a.pigsty ,endpoint: "${admin_ip}:9093" }
      blackbox     : { endpoint: "${admin_ip}:9115" }
      loki         : { endpoint: "${admin_ip}:3100" }
默认配置意味着,用户默认可以通过:
h.pigsty访问home服务器,这是默认服务器,对应 Pigsty 的文件系统首页与本地软件源,通常指向本机上的/www目录。g.pigsty访问grafana服务器,这是默认的 Grafana 服务,通常指向管理节点(admin_ip)上的3000端口。p.pigsty访问prometheus服务器,这是默认的 Prometheus 服务,通常指向管理节点(admin_ip)上的9090端口。a.pigsty访问alertmanager服务器,这是默认的 Alertmanager 服务,通常指向管理节点(admin_ip)上的9093端口。
注意这里的 blackbox 和 loki 没有配置 domain 参数,因此不会被添加到 Nginx 的配置中,因为它们没有配置 domain 参数。
但是这并不意味着用户可以直接把这两项定义移除掉,因为内网中的其他服务可能会引用这里的配置(例如日志 Agent 会引用 Loki endpoint 地址发送日志)
用户可以通过丰富的配置参数,为不同的服务配置不同的配置,如下所示:
服务器参数
每一条服务器记录都有一个独一无二的 name 作为 key,一个配置字典作为 value。在配置字典中,目前有以下几个可用配置项:
-
domain:可选,指定代理的域名,如果不填写,则 Nginx 不会对外暴露此服务。对于那些需要知道
endpoint地址,但不想对外暴露的服务(例如 Loki, Blackbox Exporter),可以不填写此参数 -
endpoint:可选,指定上游服务的地址,可以是IP:PORT或者DOMAIN:PORT。- 当此服务器为上游服务时,可以指定此参数,Pigsty 会生成一个标准的反向代理配置,并将请求转发给上游的
endpoint地址。 - 此参数与
path参数是互斥的,不能同时存在:如果一个服务器是反向代理服务器,那么它不能同时是本地网页服务器。 - 在此参数值中,可以使用
${admin_ip}占位符,Pigsty会填入admin_ip的值。 - 如果指定了此参数,则 Pigsty 默认会使用
endpoint.conf配置模板,这是反向代理的标准模板 - 如果同时指定了
conf参数,则conf参数指定的模板有更高的优先级。 - 如果上游强制要求 HTTPS 访问,你可以额外设置
scheme: https参数。
- 当此服务器为上游服务时,可以指定此参数,Pigsty 会生成一个标准的反向代理配置,并将请求转发给上游的
-
path:可选,指定本地 Web 服务器的根目录,可以是绝对路径或者相对路径。- 当此服务器为本地 Web 服务器时,可以指定此参数,Pigsty 会生成一个标准的本地 Web 服务器配置,并将请求转发给本地的
path目录。 - 此参数与
endpoint参数是互斥的,不能同时存在,如果一个服务器是本地网页服务器,那么它不能同时是上游代理服务器。 - 如果指定了此参数,则 Pigsty 默认会使用
path.conf配置模板,这是本地 Web 服务器的标准模板 - 如果同时指定了
conf参数,则conf参数指定的模板有更高的优先级。 - 如果你希望 Nginx 自动生成文件列表索引,可以设置
index: true参数,默认是不打开的。
- 当此服务器为本地 Web 服务器时,可以指定此参数,Pigsty 会生成一个标准的本地 Web 服务器配置,并将请求转发给本地的
-
conf: 可选,如果指定,则将会使用templates/nginx/中定义的配置模板。- 当你想要任意定制 Nginx 配置时可以指定此参数,指定一个存在于
templates/nginx目录中的模板文件名。 - 如果没有指定此参数,Pigsty 将根据服务器的类型(Home, Proxy, Path)自动应用相应的 默认模板:
home.conf: 默认服务器的模板(用于 home)。endpoint.conf: 上游服务代理的模板(例如:用于Grafana,Prometheus 等)path.conf:本地 Web 服务器的模板(默认没有使用,但home是特殊的本地服务器)
- 当你想要任意定制 Nginx 配置时可以指定此参数,指定一个存在于
-
certbot: 可选,指定此服务器的certbot证书名称,Pigsty 会自动使用certbot生成的证书。- 如果您的证书是使用 certbot 生成的,你可以指定此参数为
certbot生成的证书名称,Pigsty 会自动使用此证书。 - 您应当填入 certbot 生成证书的域名部分。例如
certbot: pigsty.cc会自动使用- 证书:
/etc/letsencrypt/live/pigsty.cc/fullchain.pem,但可以被显式指定的cert参数(完整路径)覆盖。 - 私钥:
/etc/letsencrypt/live/pigsty.cc/privkey.pem,但可以被显式指定的key参数(完整路径)覆盖。
- 证书:
- certbot 证书名称通常与
domain参数相同,例如g.pigsty的证书名称为g.pigsty.cc,但也有特例:当你同时申请多个证书时,certbot 会生成一个捆绑证书,名称为申请列表中的第一个域名。
- 如果您的证书是使用 certbot 生成的,你可以指定此参数为
-
cert: 可选,指定此服务器的 SSL 证书文件名,需要给出完整路径。 -
key: 可选,指定此服务器的 SSL 私钥文件名,需要给出完整路径。 -
domains: 可选,除了默认的domain域名,您还可以为此服务器指定多个额外的域名 -
scheme: 可选,指定此服务器的协议(http/https),留空则默认使用 http,通常用于强制要求 HTTPS 访问的上游 Web 服务。 -
index: 可选,如果设置为true, Nginx 会为目录自动生成文件列表索引页面,方便浏览文件,对于软件仓库类通常可以打开,对于网站通常应当关闭。 -
log: 可选,如果指定,则日志将打印到<value>.log,而非默认的access.log中。- 作为特例,上游代理服务器的日志总是会打印到
<name>.log中。
- 作为特例,上游代理服务器的日志总是会打印到
复杂的配置样例
Pigsty 自带的配置模板 conf/demo.yml 有一个更详细的案例,给出了 Pigsty 文档站的配置样例。
是的,Pigsty 的文档站也是在一台普通云服务器上使用 Pigsty 本身建设的,其配置如下所示:
infra_portal:
  home         : { domain: home.pigsty.cc }
  grafana      : { domain: demo.pigsty.cc ,endpoint: "${admin_ip}:3000" ,websocket: true ,cert: /etc/cert/demo.pigsty.cc.crt ,key: /etc/cert/demo.pigsty.cc.key }
  prometheus   : { domain: p.pigsty.cc    ,endpoint: "${admin_ip}:9090" }
  alertmanager : { domain: a.pigsty.cc    ,endpoint: "${admin_ip}:9093" }
  cc           : { domain: pigsty.cc      ,path:     "/www/pigsty.cc"   ,cert: /etc/cert/pigsty.cc.crt ,key: /etc/cert/pigsty.cc.key }

  blackbox     : { endpoint: "${admin_ip}:9115" }
  loki         : { endpoint: "${admin_ip}:3100" }
  minio        : { domain: m.pigsty.cc    ,endpoint: "${admin_ip}:9001" ,scheme: https ,websocket: true }
  postgrest    : { domain: api.pigsty.cc  ,endpoint: "127.0.0.1:8884"   }
  pgadmin      : { domain: adm.pigsty.cc  ,endpoint: "127.0.0.1:8885"   }
  pgweb        : { domain: cli.pigsty.cc  ,endpoint: "127.0.0.1:8886"   }
  bytebase     : { domain: ddl.pigsty.cc  ,endpoint: "127.0.0.1:8887"   }
  jupyter      : { domain: lab.pigsty.cc  ,endpoint: "127.0.0.1:8888", websocket: true }
  gitea        : { domain: git.pigsty.cc  ,endpoint: "127.0.0.1:8889" }
  wiki         : { domain: wiki.pigsty.cc ,endpoint: "127.0.0.1:9002" }
  noco         : { domain: noco.pigsty.cc ,endpoint: "127.0.0.1:9003" }
  supa         : { domain: supa.pigsty.cc ,endpoint: "10.10.10.10:8000" ,websocket: true }
  dify         : { domain: dify.pigsty.cc ,endpoint: "10.10.10.10:8001" ,websocket: true }
  odoo         : { domain: odoo.pigsty.cc ,endpoint: "127.0.0.1:8069"   ,websocket: true }
  mm           : { domain: mm.pigsty.cc   ,endpoint: "10.10.10.10:8065" ,websocket: true }
这个文档站的 Nginx 配置要比默认的配置复杂一些:
home服务器使用了一个真实的公网域名home.pigsty.ccgrafana服务器使用了一个真实的公网域名demo.pigsty.cc,并配置了websocket: true以支持 WebSocket 连接。cc服务器是 Pigsty 的文档站,它使用了真实公网域名pigsty.cc,并指向了本地的/www/pigsty.cc目录。- 下面还定义了一系列 Docker App 服务器,将这些应用的 Web 界面通过域名对外暴露。
cc与grafana直接通过cert与key参数指定了 HTTPS 证书。
配置域名
您可以通过 IP:Port 直接访问特定服务,例如 IP:3000 访问 Grafana,IP:9090 访问 Prometheus。 但这样的行为通常并不可取,常规安全最佳实践要求您通过域名访问服务,而不是通过 IP:Port 直接访问。 通过域名访问意味着你只需要对外暴露一个 Nginx 服务,减小攻击面,并便于统一添加访问控制!
小知识:Nginx 是如何区分不同服务器的?
Nginx 通过浏览器设置的 HOST 首部中的域名,来区分不同的服务。
所以如果您有多种服务,尽管都使用同一个 IP 地址的 80/443 端口,但 Nginx 仍然可以区分它们。
但限制条件就是,您 必须 通过域名访问服务,而不是通过 IP:Port 直接访问。如果您直接用 IP 来访问 80/443 端口,那么您只能访问到默认的 home 服务器。
使用域名访问 Pigsty WebUI 时,您需要配置 DNS 解析,有以下几种方式:
- 使用真域名,通过云厂商/域名厂商的 DNS 解析服务,将公网域名指向你的服务器公网IP
- 使用内网域名,在内网 DNS 服务器上添加内网域名,并指向你服务器的内网IP地址
- 使用本机域名,在你浏览器所在主机的(
/etc/hosts)添加一条静态解析记录
通过本机访问
如果你是唯一的用户,那么可以直接修改本地 /etc/hosts 文件(Linux/MacOS),
在 Windows 系统上,您需要修改 C:\Windows\System32\drivers\etc\hosts 文件。
无论是什么系统,修改此文件通常需要管理员权限。
你可以添加以下静态解析记录,将 Pigsty 的默认域名指向你的服务器IP地址:
<ip_address> h.pigsty a.pigsty p.pigsty g.pigsty
如果你会用到其他服务,也可以添加其他服务对应的域名解析记录:
10.10.10.10 h.pigsty a.pigsty p.pigsty g.pigsty
10.10.10.10 api.pigsty ddl.pigsty adm.pigsty cli.pigsty lab.pigsty
10.10.10.10 supa.pigsty noco.pigsty odoo.pigsty dify.pigsty
通过办公网访问
如果您的服务需要在办公网共享访问,例如让所有同事都可以通过域名访问,那么除了让同事都在自己的电脑上添加上面的静态解析记录之外,更正规的做法是使用内网DNS服务器。
您可以要求网络管理员在公司内部 DNS 服务器中添加相应的解析记录,将其指向 Nginx 服务器所在的 IP 地址。
当然还有另一种选项,Pigsty 默认安装也会在 53 端口提供一个 DNS 服务器,您可以通过配置 /etc/resolv.conf 文件或图形化界面配置 DNS 服务器,来使用内网域名访问部署在办公网中的服务。
通过互联网访问
如果您的服务需要直接暴露在互联网网上,通常您需要通过 DNS 服务商(Cloudflare,Aliyun DNS 等)解析互联网域名。 当然,你依然可以使用本地 DNS 服务器或本地静态解析记录来访问服务,但这样你的服务(除了默认的home服务器)就没法被互联网上的其他用户访问了。
您可以将所有需要暴露的域名都解析到 Nginx 服务器所在的 IP 地址。或者更简单的将 @ 和 * A 记录都解析到 Nginx 服务器所在的 IP 地址。
当你申请好新域名并将其指向你的服务器公网IP后,你还需要修改 Pigsty 的 infra_portal ,将域名填入各个服务器条目的 domain 字段中。
通过公网访问的域名,最佳实践是申请 HTTPS 证书,并始终使用 HTTPS 访问。我们将在下一节介绍这个主题。
配置HTTPS
HTTPS 是当代 Web 服务的主流配置,然而并非所有用户都熟悉 HTTPS 的配置方法。因此 Pigsty 默认为用户启用 HTTPS 支持。
如果你的 Nginx 只是对内网,办公网提供服务,那么 HTTPS 是一个 可选项; 如果你的 Nginx 需要对 互联网 提供服务,那么我们 强烈建议 您使用真实的域名与真正的 HTTPS 证书。 使用 HTTPS 不仅能够加密您的网络流量避免非法窥探篡改,而且能够避免访问 “未备案” 域名时恼人的体验。
本地域名与自签名证书
因为 Pigsty 默认使用的域名都是本地域名(x.pigsty),无法申请真正的域名 HTTPS 证书,所以 Pigsty 默认使用自签名证书。
Pigsty 会使用自签名的 CA 为所有的 infra_portal 中的域名签发证书。当然此证书并非权威证书,在浏览器中会提示证书不可信。你可以选择:
- “我知道不安全,继续访问”
- 使用 Chrome 浏览器时,你也可以使用敲击键入
thisisunsafe来绕过证书验证 - 将 Pigsty 自动生成的
pigsty-caCA 证书加入浏览器所在电脑的 信任的根 CA 列表。 - 回退到 HTTP 或者 IP:Port 访问,不使用 HTTPS (不推荐)
- 不使用本地域名与自签名证书,而是使用真正的域名与真正的 HTTPS 证书。
默认生成的自签名 CA 公钥和私钥位于 pigsty 本地目录的:files/pki/ca/ca.crt 和 files/pki/ca/ca.key。
真实域名与真证书
HTTPS 证书通常是一项收费服务,但是您可以使用诸如 certbot 这类工具申请免费的 Let’s Encrypt 证书。
使用 Certbot 申请真正 HTTPS 证书的教程将在下一篇 Certbot教程:申请免费HTTPS证书 中详细介绍。
参考阅读
3 - Certbot:申请公网HTTPS证书
Pigsty 自带了 Certbot 工具,并默认于 Infra 节点上安装启用。
这意味着你可以直接通过 certbot 命令行工具,为你的 Nginx 服务器与公网域名申请真正的 Let’Encrypt 免费 HTTPS 证书,而不是使用 Pigsty 自签名的 HTTPS 证书。
为了做到这一点,你需要:
- 确定哪些域名需要证书
- 将这些域名指向您的服务器
- 使用 Certbot 申请证书
- 将Nginx配置文件纳入管理
- 配置更新证书的定时任务
- 申请证书的一些注意事项
以下是如何去做的详细说明:
确定哪些域名需要证书
首先,您需要决定哪些 “上游服务” 需要真正的公网证书
infra_portal:
  home         : { domain: h.pigsty.cc }
  grafana      : { domain: g.pigsty.cc ,endpoint: "${admin_ip}:3000" ,websocket: true  }
  prometheus   : { domain: p.pigsty.cc ,endpoint: "${admin_ip}:9090" }
  alertmanager : { domain: a.pigsty.cc ,endpoint: "${admin_ip}:9093" }
  blackbox     : { endpoint: "${admin_ip}:9115" }
  loki         : { endpoint: "${admin_ip}:3100" }
  minio        : { domain: m.pigsty.cc    ,endpoint: "${admin_ip}:9001" ,scheme: https ,websocket: true }
  web          : { domain: pigsty.cc      ,path: "/www/web.cc" }
  repo         : { domain: repo.pigsty.cc ,path: "/www/repo"   }
例如在 infra_portal 中,假设我们要对外暴露以下五项服务:
- Grafana 可视化监控面板的
g.pigsty.cc域名 - Prometheus 时序数据库的
p.pigsty.cc域名 - AlertManager 告警面板的
a.pigsty.cc域名 - Pigsty 文档站的
pigsty.cc域名,指向本地文档目录 - Pigsty 软件仓库的
repo.pigsty.cc域名,指向软件仓库
这里的例子里特意没有选择为 home 主页申请真的 Let’s Encrypt 证书,原因见最后一节。
将这些域名指向您的服务器
接下来,您需要将上面选定的域名指向您服务器的 公网IP地址。
例如,Pigsty CC 站点的 IP 地址是 47.83.172.23,则可在域名注册商(如阿里云DNS控制台)上设置以下域名解析 A 记录:
47.83.172.23 pigsty.cc
47.83.172.23 g.pigsty.cc
47.83.172.23 p.pigsty.cc
47.83.172.23 a.pigsty.cc
47.83.172.23 repo.pigsty.cc
修改完之后,可以使用
使用 Certbot 申请证书
第一次申请的时候,certbot 会提示你输入邮箱,并是否同意协议,按提示输入即可。
$ certbot --nginx -d pigsty.cc -d repo.pigsty.cc -d g.pigsty.cc -d p.pigsty.cc -d a.pigsty.cc
Saving debug log to /var/log/letsencrypt/letsencrypt.log
Enter email address (used for urgent renewal and security notices)
 (Enter 'c' to cancel): rh@vonng.com

- - - - - - - - - - - - - - - - - - - - - - - - - - - - - - - - - - - - - - - -
Please read the Terms of Service at
https://letsencrypt.org/documents/LE-SA-v1.4-April-3-2024.pdf. You must agree in
order to register with the ACME server. Do you agree?
- - - - - - - - - - - - - - - - - - - - - - - - - - - - - - - - - - - - - - - -
(Y)es/(N)o: Y

- - - - - - - - - - - - - - - - - - - - - - - - - - - - - - - - - - - - - - - -
Would you be willing, once your first certificate is successfully issued, to
share your email address with the Electronic Frontier Foundation, a founding
partner of the Let's Encrypt project and the non-profit organization that
develops Certbot? We'd like to send you email about our work encrypting the web,
EFF news, campaigns, and ways to support digital freedom.
- - - - - - - - - - - - - - - - - - - - - - - - - - - - - - - - - - - - - - - -
(Y)es/(N)o: N
Account registered.
Requesting a certificate for pigsty.cc and 4 more domains

Successfully received certificate.
Certificate is saved at: /etc/letsencrypt/live/pigsty.cc/fullchain.pem
Key is saved at:         /etc/letsencrypt/live/pigsty.cc/privkey.pem
This certificate expires on 2025-05-18.
These files will be updated when the certificate renews.
Certbot has set up a scheduled task to automatically renew this certificate in the background.

Deploying certificate
Successfully deployed certificate for pigsty.cc to /etc/nginx/conf.d/web.conf
Successfully deployed certificate for repo.pigsty.cc to /etc/nginx/conf.d/repo.conf
Successfully deployed certificate for g.pigsty.cc to /etc/nginx/conf.d/grafana.conf
Successfully deployed certificate for p.pigsty.cc to /etc/nginx/conf.d/prometheus.conf
Successfully deployed certificate for a.pigsty.cc to /etc/nginx/conf.d/alertmanager.conf
Congratulations! You have successfully enabled HTTPS on https://pigsty.cc, https://repo.pigsty.cc, https://g.pigsty.cc, https://p.pigsty.cc, and https://a.pigsty.cc

- - - - - - - - - - - - - - - - - - - - - - - - - - - - - - - - - - - - - - - -
If you like Certbot, please consider supporting our work by:
 * Donating to ISRG / Let's Encrypt:   https://letsencrypt.org/donate
 * Donating to EFF:                    https://eff.org/donate-le
- - - - - - - - - - - - - - - - - - - - - - - - - - - - - - - - - - - - - - - -
首次申请之后,以后申请就可以省略这些步骤,直接使用这些命令了。
更简单的办法是直接以非交互式的方法调用,直接使用以下命令,传入你的邮箱和要注册的域名。
certbot --nginx --agree-tos --email rh@vonng.com -n -d supa.pigsty.cc
将Nginx配置文件纳入管理
使用 certbot 签发证书后,默认会修改 Nginx 的配置文件,将 HTTP 服务器重定向到 HTTPS 服务器,而这可能并非你想要的。
你可以通过修改 Pigsty 配置文件中的 infra_portal 参数,将 Certbot 已经 成功签发证书的域名配置到 Nginx 的配置文件中。
infra_portal:
  home         : { domain: h.pigsty.cc }
  grafana      : { domain: g.pigsty.cc ,endpoint: "${admin_ip}:3000" ,websocket: true , certbot: pigsty.cc }
  prometheus   : { domain: p.pigsty.cc ,endpoint: "${admin_ip}:9090"                  , certbot: pigsty.cc }
  alertmanager : { domain: a.pigsty.cc ,endpoint: "${admin_ip}:9093"                  , certbot: pigsty.cc }
  blackbox     : { endpoint: "${admin_ip}:9115" }
  loki         : { endpoint: "${admin_ip}:3100" }
  minio        : { domain: m.pigsty.cc    ,endpoint: "${admin_ip}:9001" ,scheme: https ,websocket: true    }
  web          : { domain: pigsty.cc      ,path: "/www/web.cc"                        , certbot: pigsty.cc }
  repo         : { domain: repo.pigsty.cc ,path: "/www/repo"                          , certbot: pigsty.cc }
这里,修改签发证书的服务器定义项,添加 certbot: <domain-name> ,这里的 <domain-name> 指的是 certbot 签发的文件名。
通常与 domain 一样,但如果你同时申请多个域名证书,certbot 会将其合并为一个证书,比如这里合并为两个文件:
Certificate is saved at: /etc/letsencrypt/live/pigsty.cc/fullchain.pem
Key is saved at:         /etc/letsencrypt/live/pigsty.cc/privkey.pem
因此将证书中间的 pigsty.cc 抽出来填入 certbot,然后重新运行:
./infra.yml -t nginx_config,nginx_launch
即可让 Pigsty 重新生成 Nginx 配置文件,回退 Certbot 对配置进行的其他修改,只保留申请的证书。
以后需要续期更新证书的时候就不需要重复这个过程了,直接使用 certbot renew 即可。
配置更新证书的定时任务
默认情况下,申请的证书有效期为三个月,所以如果在证书有效期到期之前,你应该使用 certbot renew 对证书进行续期。
如果你需要更新证书,执行以下命令即可。
certbot renew
在真正执行之前,你可以使用 DryRun 模式来测试续期是否正常:
certbot renew --dry-run
如果你修改过 Nginx 配置文件,请务必确保 certbot 的修改不会影响你的配置文件。
你可以将这个命令配置为 crontab ,在每个月的第一天凌晨执行续期并打印日志。
参考阅读
4 - Docker:启用容器与镜像代理
Pigsty 提供了 DOCKER 模块,但默认并不安装。
您可以使用 docker.yml 剧本在指定节点上安装并启用 Docker。
./docker.yml -l <ip|group|cls> # 在指定的节点、分组、集群上安装并启用 Docker
如何建配置代理服务器?
本文不会介绍如何“翻墙”,而是假设你已经有了一个可用的 HTTP(s) 代理服务器,应该如何配置,让 Docker 可以通过代理服务器,访问 docker hub 或 quay.io 等镜像站点:
你的代理服务器软件应该会提供一个形如:
http://<ip|domain>:<port>或者https://[user]:[pass]@<ip|domain>:<port>的代理地址
例如,假设您使用的代理服务器在 127.0.0.1:12345 上提供服务,那么你可以通过以下环境变量来使用它:
export ALL_PROXY=http://192.168.0.106:8118
export HTTP_PROXY=http://192.168.0.106:8118
export HTTPS_PROXY=http://192.168.0.106:8118
export NO_PROXY="localhost,127.0.0.1,10.0.0.0/8,192.168.0.0/16,*.pigsty,*.aliyun.com,mirrors.*,*.myqcloud.com,*.tsinghua.edu.cn"
您可以使用 curl 命令,检验代理服务器是否可以正常工作,例如成功可以访问 Google,通常说明代理服务器工作正常。
curl -x http://192.168.0.106:8118 -I http://www.google.com
如何为Docker Daemon配置代理服务器?
如果您希望 Docker 在 Pull 镜像时使用代理服务器,那么应当在 pigsty.yml 配置文件的全局变量中,指定 proxy_env 参数:
all:
  vars:
    proxy_env:                        # global proxy env when downloading packages
      no_proxy: "localhost,127.0.0.1,10.0.0.0/8,192.168.0.0/16,*.pigsty,*.aliyun.com,mirrors.*,*.myqcloud.com,*.tsinghua.edu.cn"
      http_proxy: http://192.168.0.106:8118
      all_proxy: http://192.168.0.106:8118
      https_proxy: http://192.168.0.106:8118
那么当 Docker 剧本执行,时,这些配置会被渲染为 /etc/docker/daemon.json 中的代理配置:
{
  "proxies": {
    "http-proxy": "{{ proxy_env['http_proxy'] }}",
    "https-proxy": "{{ proxy_env['http_proxy'] }}",
    "no-proxy": "{{ proxy_env['no_proxy'] }}"
  }
}
请注意,Docker Daemon 不使用
all_proxy参数
如果您希望手工指定代理服务器,可以选则直接修改 /etc/docker/daemon.json 中的 proxies 配置;
或者也可以修改 /lib/systemd/system/docker.service (Debian/Ubuntu) 与 /usr/lib/systemd/system/docker.service 的服务定义,在 [Service] 一节中添加环境变量声明,并重启生效:
[Service]
Environment="HTTP_PROXY=http://192.168.0.106:8118"
Environment="HTTPS_PROXY=http://192.168.0.106:8118"
Environment="NO_PROXY=localhost,127.0.0.1,10.0.0.0/8,192.168.0.0/16,*.pigsty,*.aliyun.com,mirrors.*,*.myqcloud.com,*.tsinghua.edu.cn"
重启后生效:
systemctl restart docker
如何使用其他镜像站点?
您可以在 docker_registry_mirrors 参数中指定其他镜像站点,例如阿里云、腾讯云、清华大学等镜像站点:
[ "https://mirror.ccs.tencentyun.com" ]         # tencent cloud mirror, intranet only
["https://registry.cn-hangzhou.aliyuncs.com"]   # aliyun cloud mirror, login required
不过目前来看,所有位于中国大陆的 DockerHub 公有镜像站都已经被封禁了,建议使用代理服务器直接访问 Docker Hub
如果您需要使用其他镜像站,例如 quay.io,可以首先执行:
docker login quay.io
username #> # input your username
password #> # input your password
5 - 使用 PostgreSQL 作为 Ansible 的配置清单与 CMDB
您可以使用 PostgreSQL 作为 Pigsty 的配置源,替代静态 YAML 配置文件。
使用 CMDB 作为 Ansible 的动态 配置清单 具有一些优点:元数据以高度结构化的方式以数据表的形式呈现,并通过数据库约束确保一致性。 同时,使用 CMDB 允许您使用第三方的工具来编辑管理 Pigsty 元数据,便于与外部系统相互集成。
Ansible配置原理
Pigsty 默认的配置文件路径在 ansible.cfg 中指定为:inventory = pigsty.yml
修改该参数,可以更改默认使用的配置文件路径。如果您将其指向一个可执行的脚本文件,那么 Ansible 会使用动态 Inventory 机制,执行该脚本,并期待该脚本返回一份配置文件。
修改配置源实质上是编辑Pigsty目录下的 ansible.cfg 实现的:
---
inventory = pigsty.yml
+++
inventory = inventory.sh
而 inventory.sh 则是一个从 PostgreSQL CMDB 的记录中,生成等效 YAML/JSON 配置文件的简单脚本。
你可以使用 bin/inventory_cmdb 切换到动态的 CMDB 清单,
使用 bin/inventory_conf 返回到本地配置文件。
你还需要使用 bin/inventory_load 将当前的配置文件清单加载到 CMDB。
加载配置
Pigsty CMDB的模式会在pg-meta元数据库初始化时自动创建(files/cmdb.sql),位于meta数据库的pigsty 模式中。使用bin/inventory_load可以将静态配置文件加载至CMDB中。
必须在元节点完整执行
infra.yml安装完毕后,方可使用 CMDB
usage: inventory_load [-h] [-p PATH] [-d CMDB_URL]

load config arguments

optional arguments:
  -h, --help            show this help message and exit„
  -p PATH, --path PATH  config path, ${PIGSTY_HOME}/pigsty.yml by default
  -d DATA, --data DATA  postgres cmdb pgurl, ${METADB_URL} by default
默认情况下,不带参数执行该脚本将会把$PIGSTY_HOME/pigsty.yml的名称载入默认CMDB中。
bin/inventory_load
bin/inventory_load -p conf/demo.yml
bin/inventory_load -p conf/prod.yml -d postgresql://dbuser_meta:DBUser.Meta@10.10.10.10:5432/meta
当原有配置文件加载至 CMDB 作为初始数据后,即可配置 Ansible 使用 CMDB 作为配置源:
bin/inventory_cmdb
您可以切换回静态配置文件:
bin/inventory_conf
6 - 使用 PostgreSQL 作为 Grafana 后端数据库
您可以使用 PostgreSQL 作为 Grafana 后端使用的数据库。
这是了解Pigsty部署系统使用方式的好机会,完成此教程,您会了解:
- 如何创建新数据库集群
- 如何在已有数据库集群中创建新业务用户
- 如何在已有数据库集群中创建新业务数据库
- 如何访问Pigsty所创建的数据库
- 如何管理Grafana中的监控面板
- 如何管理Grafana中的PostgreSQL数据源
- 如何一步到位完成Grafana数据库升级
太长不看
vi pigsty.yml # 取消注释DB/User定义:dbuser_grafana  grafana
bin/pgsql-user  pg-meta  dbuser_grafana
bin/pgsql-db    pg-meta  grafana

psql postgres://dbuser_grafana:DBUser.Grafana@meta:5436/grafana -c \
  'CREATE TABLE t(); DROP TABLE t;' # 检查连接串可用性

vi /etc/grafana/grafana.ini # 修改 [database] type url
systemctl restart grafana-server
创建数据库集群
我们可以在pg-meta上定义一个新的数据库grafana,也可以在新的机器节点上创建一个专用于Grafana的数据库集群:pg-grafana
定义集群
如果需要创建新的专用数据库集群pg-grafana,部署在10.10.10.11,10.10.10.12两台机器上,可以使用以下配置文件:
pg-grafana:
  hosts:
    10.10.10.11: {pg_seq: 1, pg_role: primary}
    10.10.10.12: {pg_seq: 2, pg_role: replica}
  vars:
    pg_cluster: pg-grafana
    pg_databases:
      - name: grafana
        owner: dbuser_grafana
        revokeconn: true
        comment: grafana primary database
    pg_users:
      - name: dbuser_grafana
        password: DBUser.Grafana
        pgbouncer: true
        roles: [dbrole_admin]
        comment: admin user for grafana database
创建集群
使用以下命令完成数据库集群pg-grafana的创建:pgsql.yml。
bin/createpg pg-grafana # 初始化pg-grafana集群
该命令实际上调用了Ansible Playbook pgsql.yml 创建数据库集群。
./pgsql.yml -l pg-grafana # 实际执行的等效Ansible剧本命令
定义在 pg_users 与 pg_databases 中的业务用户与业务数据库会在集群初始化时自动创建,因此使用该配置时,集群创建完毕后,(在没有DNS支持的情况下)您可以使用以下连接串访问数据库(任一即可):
postgres://dbuser_grafana:DBUser.Grafana@10.10.10.11:5432/grafana # 主库直连
postgres://dbuser_grafana:DBUser.Grafana@10.10.10.11:5436/grafana # 直连default服务
postgres://dbuser_grafana:DBUser.Grafana@10.10.10.11:5433/grafana # 连接串读写服务

postgres://dbuser_grafana:DBUser.Grafana@10.10.10.12:5432/grafana # 主库直连
postgres://dbuser_grafana:DBUser.Grafana@10.10.10.12:5436/grafana # 直连default服务
postgres://dbuser_grafana:DBUser.Grafana@10.10.10.12:5433/grafana # 连接串读写服务
因为默认情况下Pigsty安装在单个元节点上,接下来的步骤我们会在已有的pg-meta数据库集群上创建Grafana所需的用户与数据库,而并非使用这里创建的pg-grafana集群。
创建Grafana业务用户
通常业务对象管理的惯例是:先创建用户,再创建数据库。
因为如果为数据库配置了owner,数据库对相应的用户存在依赖。
定义用户
要在pg-meta集群上创建用户dbuser_grafana,首先将以下用户定义添加至pg-meta的集群定义中:
添加位置:all.children.pg-meta.vars.pg_users
- name: dbuser_grafana
  password: DBUser.Grafana
  comment: admin user for grafana database
  pgbouncer: true
  roles: [ dbrole_admin ]
如果您在这里定义了不同的密码,请在后续步骤中将相应参数替换为新密码
创建用户
使用以下命令完成dbuser_grafana用户的创建(任一均可)。
bin/pgsql-user pg-meta dbuser_grafana # 在pg-meta集群上创建`dbuser_grafana`用户
实际上调用了Ansible Playbook pgsql-createuser.yml 创建用户
./pgsql-user.yml -l pg-meta -e pg_user=dbuser_grafana # Ansible
dbrole_admin 角色具有在数据库中执行DDL变更的权限,这正是Grafana所需要的。
创建Grafana业务数据库
定义数据库
创建业务数据库的方式与业务用户一致,首先在pg-meta的集群定义中添加新数据库grafana的定义。
添加位置:all.children.pg-meta.vars.pg_databases
- { name: grafana, owner: dbuser_grafana, revokeconn: true }
创建数据库
使用以下命令完成grafana数据库的创建(任一均可)。
bin/pgsql-db pg-meta grafana # 在`pg-meta`集群上创建`grafana`数据库
实际上调用了Ansible Playbook pgsql-createdb.yml 创建数据库
./pgsql-db.yml -l pg-meta -e pg_database=grafana # 实际执行的Ansible剧本
使用Grafana业务数据库
检查连接串可达性
postgres://dbuser_grafana:DBUser.Grafana@meta:5432/grafana # 直连
postgres://dbuser_grafana:DBUser.Grafana@meta:5436/grafana # default服务
postgres://dbuser_grafana:DBUser.Grafana@meta:5433/grafana # primary服务
这里,我们将使用通过负载均衡器直接访问主库的 Default服务访问数据库。
首先检查连接串是否可达,以及是否有权限执行DDL命令。
psql postgres://dbuser_grafana:DBUser.Grafana@meta:5436/grafana -c \
  'CREATE TABLE t(); DROP TABLE t;'
直接修改Grafana配置
为了让Grafana使用 Postgres 数据源,您需要编辑 /etc/grafana/grafana.ini,并修改配置项:
[database]
;type = sqlite3
;host = 127.0.0.1:3306
;name = grafana
;user = root
# If the password contains # or ; you have to wrap it with triple quotes. Ex """#password;"""
;password =
;url =
将默认的配置项修改为:
[database]
type = postgres
url =  postgres://dbuser_grafana:DBUser.Grafana@meta/grafana
随后重启Grafana即可:
systemctl restart grafana-server
从监控系统中看到新增的 grafana 数据库已经开始有活动,则说明Grafana已经开始使用Postgres作为首要后端数据库了。
但一个新的问题是,Grafana中原有的Dashboards与Datasources都消失了!这里需要重新导入监控面板与Postgres数据源
管理Grafana监控面板
您可以使用管理用户前往 Pigsty 目录下的files/ui目录,执行grafana.py init重新加载Pigsty监控面板。
cd ~/pigsty/files/ui
./grafana.py init    # 使用当前目录下的Dashboards初始化Grafana监控面板
执行结果:
vagrant@meta:~/pigsty/files/ui
$ ./grafana.py init
Grafana API: admin:pigsty @ http://10.10.10.10:3000
init dashboard : home.json
init folder pgcat
init dashboard: pgcat / pgcat-table.json
init dashboard: pgcat / pgcat-bloat.json
init dashboard: pgcat / pgcat-query.json
init folder pgsql
init dashboard: pgsql / pgsql-replication.json
init dashboard: pgsql / pgsql-table.json
init dashboard: pgsql / pgsql-activity.json
init dashboard: pgsql / pgsql-cluster.json
init dashboard: pgsql / pgsql-node.json
init dashboard: pgsql / pgsql-database.json
init dashboard: pgsql / pgsql-xacts.json
init dashboard: pgsql / pgsql-overview.json
init dashboard: pgsql / pgsql-session.json
init dashboard: pgsql / pgsql-tables.json
init dashboard: pgsql / pgsql-instance.json
init dashboard: pgsql / pgsql-queries.json
init dashboard: pgsql / pgsql-alert.json
init dashboard: pgsql / pgsql-service.json
init dashboard: pgsql / pgsql-persist.json
init dashboard: pgsql / pgsql-proxy.json
init dashboard: pgsql / pgsql-query.json
init folder pglog
init dashboard: pglog / pglog-instance.json
init dashboard: pglog / pglog-analysis.json
init dashboard: pglog / pglog-session.json
该脚本会侦测当前的环境(安装时定义于~/pigsty),获取Grafana的访问信息,并将监控面板中的URL连接占位符域名(*.pigsty)替换为真实使用的域名。
export GRAFANA_ENDPOINT=http://10.10.10.10:3000
export GRAFANA_USERNAME=admin
export GRAFANA_PASSWORD=pigsty

export NGINX_UPSTREAM_YUMREPO=yum.pigsty
export NGINX_UPSTREAM_CONSUL=c.pigsty
export NGINX_UPSTREAM_PROMETHEUS=p.pigsty
export NGINX_UPSTREAM_ALERTMANAGER=a.pigsty
export NGINX_UPSTREAM_GRAFANA=g.pigsty
export NGINX_UPSTREAM_HAPROXY=h.pigsty
题外话,使用grafana.py clean会清空目标监控面板,使用grafana.py load会加载当前目录下所有监控面板,当Pigsty的监控面板发生变更,可以使用这两个命令升级所有的监控面板。
管理Postgres数据源
当使用 pgsql.yml 创建新PostgreSQL集群,或使用pgsql-createdb.yml创建新业务数据库时,Pigsty会在Grafana中注册新的PostgreSQL数据源,您可以使用默认的监控用户通过Grafana直接访问目标数据库实例。应用pgcat的绝大部分功能有赖于此。
要注册Postgres数据库,可以使用pgsql.yml中的register_grafana任务:
./pgsql.yml -t register_grafana             # 重新注册当前环境中所有Postgres数据源
./pgsql.yml -t register_grafana -l pg-test  # 重新注册 pg-test 集群中所有的数据库
一步到位更新Grafana
您可以直接通过修改Pigsty配置文件,更改Grafana使用的后端数据源,一步到位的完成切换Grafana后端数据库的工作。编辑pigsty.yml中grafana_database与grafana_pgurl参数,将其修改为:
grafana_database: postgres
grafana_pgurl: postgres://dbuser_grafana:DBUser.Grafana@meta:5436/grafana
然后重新执行 infral.yml中的grafana任务,即可完成 Grafana升级
./infra.yml -t grafana
7 - 使用 TimescaleDB + Promscale 存储 Prometheus 时序指标数据
虽然这并不是推荐的行为,但这是了解Pigsty部署系统使用方式的好机会。
注意,使用 Promscale 存储 Prometheus 指标占用的存储空间大约是 Prometheus 的 4 倍,但是可以使用 SQL 来查询分析 Prometheus 监控指标。
准备Postgres数据库
vi pigsty.yml # 取消注释DB/User定义:dbuser_prometheus  prometheus

pg_databases:                           # define business users/roles on this cluster, array of user definition
  - { name: prometheus, owner: dbuser_prometheus , revokeconn: true, comment: prometheus primary database }
pg_users:                           # define business users/roles on this cluster, array of user definition
  - {name: dbuser_prometheus , password: DBUser.Prometheus ,pgbouncer: true , createrole: true,  roles: [dbrole_admin], comment: admin user for prometheus database }
创建 Prometheus 业务数据库与业务用户。
bin/createuser  pg-meta  dbuser_prometheus
bin/createdb    pg-meta  prometheus
检查数据库可用性并创建扩展
psql postgres://dbuser_prometheus:DBUser.Prometheus@10.10.10.10:5432/prometheus -c 'CREATE EXTENSION timescaledb;'
配置Promscale
在元节点上执行以下命令安装 promscale
yum install -y promscale
如果默认软件包中没有,可以直接下载:
wget https://github.com/timescale/promscale/releases/download/0.6.1/promscale_0.6.1_Linux_x86_64.rpm
sudo rpm -ivh promscale_0.6.1_Linux_x86_64.rpm
编辑 promscale 的配置文件 /etc/sysconfig/promscale.conf
PROMSCALE_DB_HOST="127.0.0.1"
PROMSCALE_DB_NAME="prometheus"
PROMSCALE_DB_PASSWORD="DBUser.Prometheus"
PROMSCALE_DB_PORT="5432"
PROMSCALE_DB_SSL_MODE="disable"
PROMSCALE_DB_USER="dbuser_prometheus"
最后启动promscale,它会访问安装有 timescaledb 的数据库实例,并创建所需的schema
# launch
cat /usr/lib/systemd/system/promscale.service
systemctl start promscale && systemctl status promscale
配置Prometheus
Prometheus可以使用Remote Write/ Remote Read的方式,通过Promscale,使用Postgres作为远程存储。
编辑Prometheus配置文件:
vi /etc/prometheus/prometheus.yml
添加以下记录:
remote_write:
  - url: "http://127.0.0.1:9201/write"
remote_read:
  - url: "http://127.0.0.1:9201/read"
重启Prometheus后,监控数据即可放入Postgres中。
systemctl restart prometheus
8 - 使用 Keepalived 为 Pigsty 节点集群配置二层 VIP
您可以在节点集群上绑定一个可选的 L2 VIP —— 前提条件是:集群中的所有节点都在一个二层网络中。
在节点集群(任何一个 Ansible Group,包括数据库集群定义都可以视作一个节点集群)上,启用 vip_enabled 参数,即可在节点集群上启用 Keepalived ,绑定一个2层 VIP。
proxy:
  hosts:
    10.10.10.29: { nodename: proxy-1 } # 您可以显式指定初始的 VIP 角色:MASTER / BACKUP
    10.10.10.30: { nodename: proxy-2 } # , vip_role: master }
  vars:
    node_cluster: proxy
    vip_enabled: true
    vip_vrid: 128
    vip_address: 10.10.10.99
    vip_interface: eth1
使用以下命令,刷新节点的 Keepalived 配置,并生效:
./node.yml -l proxy -t node_vip     # 首次启用 VIP
./node.yml -l proxy -t vip_refresh  # 刷新 vip 配置(例如指定 master)
专用的场景
针对 PostgreSQL 高可用场景, Pigsty 提供了基于 vip-manager 的 L2 VIP 解决方案。
vip-manager 是一个独立的组件,它读取 etcd 中的 PostgreSQL 集群领导者,并在领导者所在节点上绑定一个 L2 VIP。
因此我们建议您使用 vip-manager 来实现 PostgreSQL 的高可用性,而不是使用 Keepalived 来实现。请参考 PGSQL VIP 了解更多。
不适用的场景
在诸如 AWS,阿里云这样的云环境中,通常不支持使用 L2 VIP。
在这种情况下,我们建议您使用四层负载均衡器来实现类似的功能。
例如 Pigsty 提供了 HAProxy 的配置支持。
9 - 使用 VIP-Manager 为 PostgreSQL 集群配置二层 VIP
您可以在 PostgreSQL 集群上绑定一个可选的 L2 VIP —— 前提条件是:集群中的所有节点都在一个二层网络中。
这个 L2 VIP 强制使用 Master - Backup 模式,Master 始终指向在数据库集群主库实例所在的节点。
这个 VIP 由 VIP-Manager 组件管理,它会从 DCS (etcd) 中直接读取由 Patroni 写入的 Leader Key,从而判断自己是否是 Master。
启用VIP
在 PostgreSQL 集群上定义 pg_vip_enabled 参数为 true,即可在集群上启用 VIP 组件。当然您也可以在全局配置中启用此配置项。
# pgsql 3 node ha cluster: pg-test
pg-test:
  hosts:
    10.10.10.11: { pg_seq: 1, pg_role: primary }   # primary instance, leader of cluster
    10.10.10.12: { pg_seq: 2, pg_role: replica }   # replica instance, follower of leader
    10.10.10.13: { pg_seq: 3, pg_role: replica, pg_offline_query: true } # replica with offline access
  vars:
    pg_cluster: pg-test           # define pgsql cluster name
    pg_users:  [{ name: test , password: test , pgbouncer: true , roles: [ dbrole_admin ] }]
    pg_databases: [{ name: test }]

    # 启用 L2 VIP
    pg_vip_enabled: true
    pg_vip_address: 10.10.10.3/24
    pg_vip_interface: eth1
请注意,pg_vip_address 必须是一个合法的 IP 地址,带有网段,且在当前二层网络中可用。
请注意,pg_vip_interface 必须是一个合法的网络接口名,并且应当是与 inventory 中使用 IPv4 地址一致的网卡。
如果集群成员的网卡名不一样,用户应当为每个实例显式指定 pg_vip_interface 参数,例如:
pg-test:
  hosts:
    10.10.10.11: { pg_seq: 1, pg_role: primary , pg_vip_interface: eth0  }
    10.10.10.12: { pg_seq: 2, pg_role: replica , pg_vip_interface: eth1  }
    10.10.10.13: { pg_seq: 3, pg_role: replica , pg_vip_interface: ens33 }
  vars:
    pg_cluster: pg-test           # define pgsql cluster name
    pg_users:  [{ name: test , password: test , pgbouncer: true , roles: [ dbrole_admin ] }]
    pg_databases: [{ name: test }]

    # 启用 L2 VIP
    pg_vip_enabled: true
    pg_vip_address: 10.10.10.3/24
    #pg_vip_interface: eth1
使用以下命令,刷新 PG 的 vip-manager 配置并重启生效:
./pgsql.yml -t pg_vip
10 - HugePage:为数据库启用大页支持
内存大页的优缺点
对于数据库来说,启用大页有好处,也有缺点。
- OLAP 场景下的显著性能收益:大数据量扫描与批量计算
- 更可控的内存分配模型:启动时“锁定”需要的内存
- 提升内存访问效率,减少 TLB miss
- 降低内核页表维护开销
但也伴随着一些缺点:
- 额外的配置与维护复杂度
- 大页内存被锁定,对系统整体资源弹性要求高的环境来说缺乏灵活性
- 小规模内存场景收益有限,甚至会适得其反
请注意,HugePage 和 Transparent HugePage (透明大页)是两个不同的概念, Pigsty 会强制关闭 Transparent HugePage 以遵循数据库最佳实践。
什么时候启用大页?
如果你的场景满足以下条件,我们建议启用大页:
- OLAP 分析场景
- 超过 几十GB 的内存
- PostgreSQL 15+
- Linux 内核版本 > 3.10 (> EL7, > Ubuntu 16)
Pigsty 默认不启用大页,但你可以通过简单的配置启用,并配置为 PostgreSQL 专属的内存。
分配节点大页
要为节点启用大页面,用户可以使用以下两个参数:
node_hugepage_count:精确指定要分配的 2MB 内存大页数量node_hugepage_ratio:指定一个百分比,将内存的一部分以大页形式分配
这两个参数二选一,你可以直接指定要分配的(2MB)大页数量,或指定分配为大页的内存比例(0.00 - 0.90 ),前者具有更高优先级。
node_hugepage_count: 0            # 精确指定 2MB 大页面数量,优先级要高于 node_hugepage_ratio
node_hugepage_ratio: 0            # 分配为 2MB 大页面的内存比例,优先级要低于 node_hugepage_count
应用生效:
./node.yml -t node_tune
本质上是在:/etc/sysctl.d/hugepage.conf 中写入了 vm.nr_hugepages 参数值并执行了 sysctl -p 应用生效。
./node.yml -t node_tune -e node_hugepage_count=3000    # 精确分配 5000 个 2MB 大页(10GB)
./node.yml -t node_tune -e node_hugepage_ratio=0.30    # 以大页形式分配 30% 的内存
请注意,以上参数只是为节点启用大页,不仅仅是 PostgreSQL 可以使用。
PostgreSQL 服务器默认会在启动时尝试使用大页,如果系统中可用的大页数量不足,PostgreSQL 会继续使用普通页面启动。
如果你尝试降低大页数量,只有未被使用与保留的大页(Free)会被释放,已经被使用的大页会在进程退出后释放。
Pigsty 最多允许分配 90% 的内存作为大页,但对于 PostgreSQL 数据库来说,合理的范围通常在 25% - 40% 的内存。
建议用户设置:node_hugepage_ratio=0.30,并在 PostgreSQL 启动后按需进一步调整大页数量。
查看大页状态
最直观的查看方法是使用 Pigsty 监控系统,这里给出了调整大页时的一个监控图表样例:
- Node Instance - Memory - HugePages Allocation

- 默认状态
- 启用大页,未使用
- 重启 PG ,使用/保留了一部分大页
- 进一步使用 PG,使用了更多大页
- 缩减大页数量,回收未使用的大页
- 重启 PG,彻底释放保留的大页
你可以直接 cat /proc/meminfo | grep Huge 查看大页状态。
$ cat /proc/meminfo | grep Huge
默认情况下,没有启用大页面,大页面数量(Total)为 0:
AnonHugePages:      8192 kB
ShmemHugePages:        0 kB
FileHugePages:         0 kB
HugePages_Total:       0
HugePages_Free:        0
HugePages_Rsvd:        0
HugePages_Surp:        0
Hugepagesize:       2048 kB
Hugetlb:               0 kB
启用了大页面,总共有 6015 个大页面,全部空闲可用:
AnonHugePages:      8192 kB
ShmemHugePages:        0 kB
FileHugePages:         0 kB
HugePages_Total:    6015
HugePages_Free:     6015
HugePages_Rsvd:        0
HugePages_Surp:        0
Hugepagesize:       2048 kB
Hugetlb:        12318720 kB
如果这时候重启 PostgreSQL (默认会尝试使用大页)
sudo su - postgres
pg-restart
那么 PostgreSQL 会使用 保留预定 (Rsvd,Reserved)所需的大页,用于共享缓冲区,例如这里保留了 5040 个。
AnonHugePages:      8192 kB
ShmemHugePages:        0 kB
FileHugePages:         0 kB
HugePages_Total:    6015
HugePages_Free:     5887
HugePages_Rsvd:     5040
HugePages_Surp:        0
Hugepagesize:       2048 kB
Hugetlb:        12318720 kB
如果我们给 PostgreSQL 增加一些负载,比如 pgbench -is10 ,那么 PostgreSQL 会开始使用更多大页(Alloc = Total - Free)。
请注意,大页一旦被(分配或者预定),即使你将系统的 vm.nr_hugepages 参数调小,这些页面也依然会被保留,直到使用完毕。
因此,如果你想要真正回收这些大页,需要重启 PostgreSQL 服务。
./node.yml -t node_tune -e node_hugepage_count=3000 # 分配 3000 大页
精准分配大页
在 PostgreSQL 启动前,您需要分配 足够多的 大页,否则 PostgreSQL 将无法使用这些大页。
在 Pigsty 中,默认使用的 SharedBuffer 不超过内存的 25% ,所以您可以分配 26% ~ 27% 的内存作为大页,以确保 PostgreSQL 可以使用大页。
node_hugepage_ratio: 0.27 # 先分配 27% 内存作为大页,肯定够 PG 用了
如果不在乎少量资源浪费,您可以直接分配 27% 左右的内存作为大页。
回收脚本
PG 启动后,使用以下 SQL 可以查询到 PostgreSQL 实际使用的大页数量:
SHOW shared_memory_size_in_huge_pages;
最后,您可以精确指定所需的大页数量:
node_hugepage_count: 3000 # 精确分配 3000 个 2MB 大页(6GB)
然而,要精准的一个不漏的统计所需的大页数量,通常要等到 PostgreSQL 服务器启动后才能获取。
所以折中的办法是,提前超量分配大页启动 PostgreSQL 后,从 PG 中查询得到所需的精准大页数量,然后再精确修改所需大页的数量。
让PG独占大页
默认情况下,所有进程都可以去使用大页,如果用户希望仅允许 PostgreSQL 数据库使用大页,可以修改 vm.hugetlb_shm_group 内核参数
你可以调整 node_sysctl_params 参数,将 PostgreSQL 的 GID 填入。
node_sysctl_params:
vm.hugetlb_shm_group: 26node_sysctl_params:
vm.hugetlb_shm_group: 543注意 EL/Debian PostgreSQL UID/GID 默认值不同,分别为
26,543(可以显式通过pg_dbsu_uid修改)
想要移除此变更:
sysctl -p /etc/sysctl.d/hugepage.conf
快速调整脚本
浪费的大页部分可以使用 pg-tune-hugepage 脚本对其进行回收,不过此脚本仅 PostgreSQL 15+ 可用。
如果你的 PostgreSQL 已经在运行,你可以使用下面的办法启动大页(仅 PG15+ 可用):
sync; echo 3 > /proc/sys/vm/drop_caches   # 刷盘,释放系统缓存(请做好数据库性能受到冲击的准备)
sudo /pg/bin/pg-tune-hugepage             # 将 nr_hugepages 写入 /etc/sysctl.d/hugepage.conf
pg restart <cls>                          # 重启 postgres 以使用 hugepage
执行 pg-tune-hugepage 的样例输出:
$ /pg/bin/pg-tune-hugepage
[INFO] Querying PostgreSQL for hugepage requirements...
[INFO] Added safety margin of 0 hugepages (5168 → 5168)
[INFO] ==================================
PostgreSQL user: postgres
PostgreSQL group ID: 26
Required hugepages: 5168
Configuration file: /etc/sysctl.d/hugepage.conf
[BEFORE] ================================
Current memory information:
AnonHugePages:      8192 kB
ShmemHugePages:        0 kB
FileHugePages:         0 kB
HugePages_Total:   10025
HugePages_Free:     9896
HugePages_Rsvd:     5039
HugePages_Surp:        0
Hugepagesize:       2048 kB
Hugetlb:        20531200 kB
Current sysctl settings:
vm.hugetlb_shm_group = 26
vm.nr_hugepages = 10025
vm.nr_hugepages_mempolicy = 10025
[EXECUTE] ===============================
Writing new hugepage configuration...
Applying new settings...
vm.nr_hugepages = 5168
vm.hugetlb_shm_group = 26
[AFTER] =================================
Updated memory information:
AnonHugePages:      8192 kB
ShmemHugePages:        0 kB
FileHugePages:         0 kB
HugePages_Total:    5168
HugePages_Free:     5039
HugePages_Rsvd:     5039
HugePages_Surp:        0
Hugepagesize:       2048 kB
Hugetlb:        10584064 kB
Updated sysctl settings:
vm.hugetlb_shm_group = 26
vm.nr_hugepages = 5168
vm.nr_hugepages_mempolicy = 5168
[DONE] ==================================
PostgreSQL hugepage configuration complete.

Consider adding the following to your inventory file:
node_hugepage_count: 5168
node_sysctl_params: {vm.hugetlb_shm_group: 26}
参考
11 - Citus:部署原生高可用集群
Citus 是一个 PostgreSQL 扩展,可以将 PostgreSQL 原地转换为一个分布式数据库,并实现在多个节点上水平扩展,以处理大量数据和大量查询。
Patroni 在 v3.0 后,提供了对 Citus 原生高可用的支持,简化了 Citus 集群的搭建,Pigsty 也对此提供了原生支持。
Citus集群
Pigsty 原生支持 Citus。可以参考 conf/citus.yml,以及更复杂的 十节点集群。
这里使用 Pigsty 四节点沙箱,定义了一个 Citus 集群 pg-citus,其中包括一个两节点的协调者(Coordinator)集群 pg-citus0,以及两个工作者(Worker)集群 pg-citus1,pg-citus2。
pg-citus:
  hosts:
    10.10.10.10: { pg_group: 0, pg_cluster: pg-citus0 ,pg_vip_address: 10.10.10.2/24 ,pg_seq: 1, pg_role: primary }
    10.10.10.11: { pg_group: 0, pg_cluster: pg-citus0 ,pg_vip_address: 10.10.10.2/24 ,pg_seq: 2, pg_role: replica }
    10.10.10.12: { pg_group: 1, pg_cluster: pg-citus1 ,pg_vip_address: 10.10.10.3/24 ,pg_seq: 1, pg_role: primary }
    10.10.10.13: { pg_group: 2, pg_cluster: pg-citus2 ,pg_vip_address: 10.10.10.4/24 ,pg_seq: 1, pg_role: primary }
  vars:
    pg_mode: citus                            # pgsql cluster mode: citus
    pg_version: 16                            # citus does not have pg16 available
    pg_shard: pg-citus                        # citus shard name: pg-citus
    pg_primary_db: citus                      # primary database used by citus
    pg_vip_enabled: true                      # enable vip for citus cluster
    pg_vip_interface: eth1                    # vip interface for all members
    pg_dbsu_password: DBUser.Postgres         # all dbsu password access for citus cluster
    pg_extensions: [ citus, postgis, pgvector, topn, pg_cron, hll ]  # install these extensions
    pg_libs: 'citus, pg_cron, pg_stat_statements' # citus will be added by patroni automatically
    pg_users: [{ name: dbuser_citus ,password: DBUser.Citus ,pgbouncer: true ,roles: [ dbrole_admin ]    }]
    pg_databases: [{ name: citus ,owner: dbuser_citus ,extensions: [ citus, vector, topn, pg_cron, hll ] }]
    pg_parameters:
      cron.database_name: citus
      citus.node_conninfo: 'sslmode=require sslrootcert=/pg/cert/ca.crt sslmode=verify-full'
    pg_hba_rules:
      - { user: 'all' ,db: all  ,addr: 127.0.0.1/32  ,auth: ssl   ,title: 'all user ssl access from localhost' }
      - { user: 'all' ,db: all  ,addr: intra         ,auth: ssl   ,title: 'all user ssl access from intranet'  }
相比标准 PostgreSQL 集群,Citus 集群的配置有一些特殊之处,如下所示:
首先,你需要确保 Citus 扩展被下载,安装,加载并启用,这涉及到以下四个参数
repo_packages:必须包含citus扩展,或者你需要使用带有 Citus 扩展的 PostgreSQL 离线安装包。pg_extensions:必须包含citus扩展,即你必须在每个节点上安装citus扩展。pg_libs:必须包含citus扩展,而且首位必须为citus,但现在 Patroni 会自动完成这件事了。pg_databases: 这里要定义一个首要数据库,该数据库必须安装citus扩展。
其次,你需要确保 Citus 集群的配置正确:
pg_mode: 必须设置为citus,从而告知 Patroni 使用 Citus 模式。pg_primary_db:必须指定一个首要数据库的名称,该数据库必须安装citus扩展,这里名为citus。pg_shard:必须指定一个统一的名称,字符串,作为所有水平分片PG集群的集群名称前缀,这里为pg-citus。pg_group:必须指定一个分片号,从零开始依次分配的整数,0号固定代表协调者集群,其他为 Worker 集群。pg_cluster必须与pg_shard和pg_group组合后的结果对应。pg_dbsu_password:必须设置为非空的纯文本密码,否则 Citus 无法正常工作。pg_parameters:建议设置citus.node_conninfo参数,强制要求 SSL 访问并要求节点间验证客户端证书。
配置完成后,您可以像创建普通 PostgreSQL 集群一样,使用 pgsql.yml 剧本部署 Citus 集群。
管理Citus集群
定义好 Citus 集群后,部署 Citus 集群同样使用的剧本 pgsql.yml:
./pgsql.yml -l pg-citus # 部署 Citus 集群 pg-citus
使用任意成员的 DBSU(postgres)用户,都能通过 patronictl (alias: pg) 列出 Citus 集群的状态:
$ pg list
+ Citus cluster: pg-citus ----------+---------+-----------+----+-----------+--------------------+
| Group | Member      | Host        | Role    | State     | TL | Lag in MB | Tags               |
+-------+-------------+-------------+---------+-----------+----+-----------+--------------------+
|     0 | pg-citus0-1 | 10.10.10.10 | Leader  | running   |  1 |           | clonefrom: true    |
|       |             |             |         |           |    |           | conf: tiny.yml     |
|       |             |             |         |           |    |           | spec: 20C.40G.125G |
|       |             |             |         |           |    |           | version: '16'      |
+-------+-------------+-------------+---------+-----------+----+-----------+--------------------+
|     1 | pg-citus1-1 | 10.10.10.11 | Leader  | running   |  1 |           | clonefrom: true    |
|       |             |             |         |           |    |           | conf: tiny.yml     |
|       |             |             |         |           |    |           | spec: 10C.20G.125G |
|       |             |             |         |           |    |           | version: '16'      |
+-------+-------------+-------------+---------+-----------+----+-----------+--------------------+
|     2 | pg-citus2-1 | 10.10.10.12 | Leader  | running   |  1 |           | clonefrom: true    |
|       |             |             |         |           |    |           | conf: tiny.yml     |
|       |             |             |         |           |    |           | spec: 10C.20G.125G |
|       |             |             |         |           |    |           | version: '16'      |
+-------+-------------+-------------+---------+-----------+----+-----------+--------------------+
|     2 | pg-citus2-2 | 10.10.10.13 | Replica | streaming |  1 |         0 | clonefrom: true    |
|       |             |             |         |           |    |           | conf: tiny.yml     |
|       |             |             |         |           |    |           | spec: 10C.20G.125G |
|       |             |             |         |           |    |           | version: '16'      |
+-------+-------------+-------------+---------+-----------+----+-----------+--------------------+
您可以将每个水平分片集群视为一个独立的 PGSQL 集群,使用 pg (patronictl) 命令管理它们。
但是务必注意,当你使用 pg 命令管理 Citus 集群时,需要额外使用 --group 参数指定集群分片号
pg list pg-citus --group 0 # 需要使用 --group 0 指定集群分片号
Citus 中有一个名为 pg_dist_node 的系统表,用于记录 Citus 集群的节点信息,Patroni 会自动维护该表。
PGURL=postgres://postgres:DBUser.Postgres@10.10.10.10/citus

psql $PGURL -c 'SELECT * FROM pg_dist_node;'       # 查看节点信息
 nodeid | groupid |  nodename   | nodeport | noderack | hasmetadata | isactive | noderole  | nodecluster | metadatasynced | shouldhaveshards
--------+---------+-------------+----------+----------+-------------+----------+-----------+-------------+----------------+------------------
      1 |       0 | 10.10.10.10 |     5432 | default  | t           | t        | primary   | default     | t              | f
      4 |       1 | 10.10.10.12 |     5432 | default  | t           | t        | primary   | default     | t              | t
      5 |       2 | 10.10.10.13 |     5432 | default  | t           | t        | primary   | default     | t              | t
      6 |       0 | 10.10.10.11 |     5432 | default  | t           | t        | secondary | default     | t              | f
此外,你还可以查看用户认证信息(仅限超级用户访问):
$ psql $PGURL -c 'SELECT * FROM pg_dist_authinfo;' # 查看节点认证信息(仅限超级用户访问)
然后,你可以使用普通业务用户(例如,具有 DDL 权限的 dbuser_citus)来访问 Citus 集群:
psql postgres://dbuser_citus:DBUser.Citus@10.10.10.10/citus -c 'SELECT * FROM pg_dist_node;'
使用Citus集群
在使用 Citus 集群时,我们强烈建议您先阅读 Citus 官方文档,了解其架构设计与核心概念。
其中核心是了解 Citus 中的五种表,以及其特点与应用场景:
- 分布式表(Distributed Table)
- 参考表(Reference Table)
- 本地表(Local Table)
- 本地管理表(Local Management Table)
- 架构表(Schema Table)
在协调者节点上,您可以创建分布式表和引用表,并从任何数据节点查询它们。从 11.2 开始,任何 Citus 数据库节点都可以扮演协调者的角色了。
我们可以使用 pgbench 来创建一些表,并将其中的主表(pgbench_accounts)分布到各个节点上,然后将其他小表作为引用表:
PGURL=postgres://dbuser_citus:DBUser.Citus@10.10.10.10/citus
pgbench -i $PGURL

psql $PGURL <<-EOF
SELECT create_distributed_table('pgbench_accounts', 'aid'); SELECT truncate_local_data_after_distributing_table('public.pgbench_accounts');
SELECT create_reference_table('pgbench_branches')         ; SELECT truncate_local_data_after_distributing_table('public.pgbench_branches');
SELECT create_reference_table('pgbench_history')          ; SELECT truncate_local_data_after_distributing_table('public.pgbench_history');
SELECT create_reference_table('pgbench_tellers')          ; SELECT truncate_local_data_after_distributing_table('public.pgbench_tellers');
EOF
执行读写测试:
pgbench -nv -P1 -c10 -T500 postgres://dbuser_citus:DBUser.Citus@10.10.10.10/citus      # 直连协调者 5432 端口
pgbench -nv -P1 -c10 -T500 postgres://dbuser_citus:DBUser.Citus@10.10.10.10:6432/citus # 通过连接池,减少客户端连接数压力,可以有效提高整体吞吐。
pgbench -nv -P1 -c10 -T500 postgres://dbuser_citus:DBUser.Citus@10.10.10.13/citus      # 任意 primary 节点都可以作为 coordinator
pgbench --select-only -nv -P1 -c10 -T500 postgres://dbuser_citus:DBUser.Citus@10.10.10.11/citus # 可以发起只读查询
更严肃的生产部署
要将 Citus 用于生产环境,您通常需要为 Coordinator 和每个 Worker 集群设置流复制物理副本。
例如,在 simu.yml 中定义了一个 10 节点的 Citus 集群。
pg-citus: # citus group
  hosts:
    10.10.10.50: { pg_group: 0, pg_cluster: pg-citus0 ,pg_vip_address: 10.10.10.60/24 ,pg_seq: 0, pg_role: primary }
    10.10.10.51: { pg_group: 0, pg_cluster: pg-citus0 ,pg_vip_address: 10.10.10.60/24 ,pg_seq: 1, pg_role: replica }
    10.10.10.52: { pg_group: 1, pg_cluster: pg-citus1 ,pg_vip_address: 10.10.10.61/24 ,pg_seq: 0, pg_role: primary }
    10.10.10.53: { pg_group: 1, pg_cluster: pg-citus1 ,pg_vip_address: 10.10.10.61/24 ,pg_seq: 1, pg_role: replica }
    10.10.10.54: { pg_group: 2, pg_cluster: pg-citus2 ,pg_vip_address: 10.10.10.62/24 ,pg_seq: 0, pg_role: primary }
    10.10.10.55: { pg_group: 2, pg_cluster: pg-citus2 ,pg_vip_address: 10.10.10.62/24 ,pg_seq: 1, pg_role: replica }
    10.10.10.56: { pg_group: 3, pg_cluster: pg-citus3 ,pg_vip_address: 10.10.10.63/24 ,pg_seq: 0, pg_role: primary }
    10.10.10.57: { pg_group: 3, pg_cluster: pg-citus3 ,pg_vip_address: 10.10.10.63/24 ,pg_seq: 1, pg_role: replica }
    10.10.10.58: { pg_group: 4, pg_cluster: pg-citus4 ,pg_vip_address: 10.10.10.64/24 ,pg_seq: 0, pg_role: primary }
    10.10.10.59: { pg_group: 4, pg_cluster: pg-citus4 ,pg_vip_address: 10.10.10.64/24 ,pg_seq: 1, pg_role: replica }
  vars:
    pg_mode: citus                            # pgsql cluster mode: citus
    pg_version: 16                            # citus does not have pg16 available
    pg_shard: pg-citus                        # citus shard name: pg-citus
    pg_primary_db: citus                      # primary database used by citus
    pg_vip_enabled: true                      # enable vip for citus cluster
    pg_vip_interface: eth1                    # vip interface for all members
    pg_dbsu_password: DBUser.Postgres         # enable dbsu password access for citus
    pg_extensions: [ citus, postgis, pgvector, topn, pg_cron, hll ]  # install these extensions
    pg_libs: 'citus, pg_cron, pg_stat_statements' # citus will be added by patroni automatically
    pg_users: [{ name: dbuser_citus ,password: DBUser.Citus ,pgbouncer: true ,roles: [ dbrole_admin ]    }]
    pg_databases: [{ name: citus ,owner: dbuser_citus ,extensions: [ citus, vector, topn, pg_cron, hll ] }]
    pg_parameters:
      cron.database_name: citus
      citus.node_conninfo: 'sslrootcert=/pg/cert/ca.crt sslmode=verify-full'
    pg_hba_rules:
      - { user: 'all' ,db: all  ,addr: 127.0.0.1/32  ,auth: ssl   ,title: 'all user ssl access from localhost' }
      - { user: 'all' ,db: all  ,addr: intra         ,auth: ssl   ,title: 'all user ssl access from intranet'  }
我们将在后续教程中覆盖一系列关于 Citus 的高级主题
- 读写分离
- 故障处理
- 一致性备份与恢复
- 高级监控与问题诊断
- 连接池
12 - 高可用演习:3坏2如何处理
如果经典3节点高可用部署同时出现两台(多数主体)故障,系统通常无法自动完成故障切换,需要人工介入:
首先判断另外两台服务器的情况,如果短时间内可以拉起,优先选择拉起另外两台服务。否则进入 紧急止血流程
紧急止血流程假设您的管理节点故障,只有单台普通数据库节点存活,在这种情况下,最快的恢复操作流程为:
- 调整 HAProxy 配置,将流量指向主库。
- 关闭 Patroni,手动提升 PostgreSQL 从库为主库。
调整HAProxy配置
如果你通过其他方式绕开 HAProxy 访问集群,那么可以跳过这一步。 如果你通过 HAProxy 方式访问数据库集群,那么你需要调整负载均衡配置,将读写流量手工指向主库。
- 编辑
/etc/haproxy/<pg_cluster>-primary.cfg配置文件,其中<pg_cluster>为你的 PostgreSQL 集群名称,例如pg-meta。 - 将健康检查配置选项注释,停止进行健康鉴擦好
- 将服务器列表中,其他两台故障的机器注释掉,只保留当前主库服务器。
listen pg-meta-primary
    bind *:5433
    mode tcp
    maxconn 5000
    balance roundrobin

    # 注释掉以下四行健康检查配置
    #option httpchk                               # <---- remove this
    #option http-keep-alive                       # <---- remove this
    #http-check send meth OPTIONS uri /primary    # <---- remove this
    #http-check expect status 200                 # <---- remove this

    default-server inter 3s fastinter 1s downinter 5s rise 3 fall 3 on-marked-down shutdown-sessions slowstart 30s maxconn 3000 maxqueue 128 weight 100
    server pg-meta-1 10.10.10.10:6432 check port 8008 weight 100

    # 注释掉其他两台故障的机器
    #server pg-meta-2 10.10.10.11:6432 check port 8008 weight 100 <---- comment this
    #server pg-meta-3 10.10.10.12:6432 check port 8008 weight 100 <---- comment this
配置调整完成后,先不着急执行 systemctl reload haproxy 重载生效,等待后续主库提升后一起执行。
以上配置的效果是,HAProxy 将不再进行主库健康检查(默认使用 Patroni),而是直接将写入流量指向当前主库
手工提升备库
登陆目标服务器,切换至 dbsu 用户,执行 CHECKPOINT 刷盘后,关闭 Patroni,重启 PostgreSQL 并执行 Promote。
sudo su - postgres                     # 切换到数据库 dbsu 用户
psql -c 'checkpoint; checkpoint;'      # 两次 Checkpoint 刷脏页,避免PG后重启耗时过久
sudo systemctl stop patroni            # 关闭 Patroni
pg-restart                             # 重新拉起 PostgreSQL
pg-promote                             # 将 PostgreSQL 从库提升为主库
psql -c 'SELECT pg_is_in_recovery();'  # 如果结果为 f,表示已经提升为主库
如果你上面调整了 HAProxy 配置,那么现在可以执行 systemctl reload haproxy 重载 HAProxy 配置,将流量指向新的主库。
systemctl reload haproxy # 重载 HAProxy 配置,将写入流量指向当前实例
避免脑裂
紧急止血后,第二优先级问题为:避免脑裂。用户应当防止另外两台服务器重新上线后,与当前主库形成脑裂,导致数据不一致。
简单的做法是:
- 将另外两台服务器直接 断电/断网,确保它们不会在不受控的情况下再次上线。
- 调整应用使用的数据库连接串,将其 HOST 直接指向唯一幸存服务器上的主库。
然后应当根据具体情况,决定下一步的操作:
- A:这两台服务器是临时故障(比如断网断电),可以原地修复后继续服务
- B:这两台故障服务器是永久故障(比如硬件损坏),将移除并下线。
临时故障后的复原
如果另外两台服务器是临时故障,可以修复后继续服务,那么可以按照以下步骤进行修复与重建:
- 每次处理一台故障服务器,优先处理 管理节点 / INFRA 管理节点
- 启动故障服务器,并在启动后关停 Patroni
ETCD 集群在法定人数恢复后,将恢复工作,此时可以启动幸存服务器(当前主库)上的 Patroni,接管现有 PostgreSQL,并重新获取集群领导者身份。 Patroni 启动后进入维护模式。
systemctl restart patroni
pg pause <pg_cluster>
在另外两台实例上以 postgres 用户身份创建 touch /pg/data/standby.signal 标记文件将其标记为从库,然后拉起 Patroni:
systemctl restart patroni
确认 Patroni 集群身份/角色正常后,退出维护模式:
pg resume <pg_cluster>
永久故障后的复原
出现永久故障后,首先需要恢复管理节点上的 ~/pigsty 目录,主要是需要 pigsty.yml 与 files/pki/ca/ca.key 两个核心文件。
如果您无法取回或没有备份这两个文件,您可以选择部署一套新的 Pigsty,并通过 备份集群 的方式将现有集群迁移至新部署中。
请定期备份
pigsty目录(例如使用 Git 进行版本管理)。建议吸取教训,下次不要犯这样的错误。
配置修复
您可以将幸存的节点作为新的管理节点,将 ~/pigsty 目录拷贝到新的管理节点上,然后开始调整配置。
例如,将原本默认的管理节点 10.10.10.10 替换为幸存节点 10.10.10.12
all:
  vars:
    admin_ip: 10.10.10.12               # 使用新的管理节点地址
    node_etc_hosts: [10.10.10.12 h.pigsty a.pigsty p.pigsty g.pigsty sss.pigsty]
    infra_portal: {}                    # 一并修改其他引用旧管理节点 IP (10.10.10.10) 的配置

  children:

    infra:                              # 调整 Infra 集群
      hosts:
        # 10.10.10.10: { infra_seq: 1 } # 老的 Infra 节点
        10.10.10.12: { infra_seq: 3 }   # 新增 Infra 节点

    etcd:                               # 调整 ETCD 集群
      hosts:
        #10.10.10.10: { etcd_seq: 1 }   # 注释掉此故障节点
        #10.10.10.11: { etcd_seq: 2 }   # 注释掉此故障节点
        10.10.10.12: { etcd_seq: 3 }    # 保留幸存节点
      vars:
        etcd_cluster: etcd

    pg-meta:                            # 调整 PGSQL 集群配置
      hosts:
        #10.10.10.10: { pg_seq: 1, pg_role: primary }
        #10.10.10.11: { pg_seq: 2, pg_role: replica }
        #10.10.10.12: { pg_seq: 3, pg_role: replica , pg_offline_query: true }
        10.10.10.12: { pg_seq: 3, pg_role: primary , pg_offline_query: true }
      vars:
        pg_cluster: pg-meta
ETCD修复
然后执行以下命令,将 ETCD 重置为单节点集群:
./etcd.yml -e etcd_safeguard=false -e etcd_clean=true
根据 ETCD重载配置 的说明,调整对 ETCD Endpoint 的引用。
INFRA修复
如果幸存节点上没有 INFRA 模块,请在当前节点上配置新的 INFRA 模块并安装。执行以下命令,将 INFRA 模块部署到幸存节点上:
./infra.yml -l 10.10.10.12
修复当前节点的监控
./node.yml -t node_monitor
PGSQL修复
./pgsql.yml -t pg_conf                            # 重新生成 PG 配置文件
systemctl reload patroni                          # 在幸存节点上重载 Patroni 配置
各模块修复后,您可以参考标准扩容流程,将新的节点加入集群,恢复集群的高可用性。
13 - Restic:文件系统备份恢复
Pigsty 已经处理好了 PostgreSQL 数据库本身的备份与恢复,但如何解决普通文件/目录的备份与恢复?
对于各种使用 PostgreSQL 的业务软件来说,(例如 Odoo,GitLab),您可以考虑使用 Restic 定期备份文件系统部分的数据(例如 /data/odoo) 。
Restic 是一个非常好用的开源备份工具,支持快照,增量备份,加密,压缩等功能,并且可以使用包括 S3/MinIO 在内的多种服务作为备份仓库。 详细信息请参考 restic 文档。
快速上手
Pigsty Infra 仓库提供开箱即用的最新 Restic RPM/DEB 软件包,大部分 Linux 操作系统官方支持的发行版仓库里也提供较旧的版本。
yum install -y restic
apt install -y restic
出于演示目的,使用本地文件目录作为备份仓库,初始化仓库只需要执行一次即可
mkdir -p /data/backups/restic
export RESTIC_REPOSITORY=/data/backups/restic
export RESTIC_PASSWORD=some-strong-password
restic init
接下来,你可以进行备份,查看快照,恢复文件等操作:
restic backup /www/web.cc               # 将 /www/web.cc 目录备份到仓库
restic snapshots                        # 查看备份快照列表
restic restore -t /tmp/web.cc 0b11f778  # 将快照 0b11f778 恢复到 /tmp/web.cc
restic check                            # 定期检查仓库完整性
完整命令输出
$ restic backup /www/web.cc
repository fcd37256 opened (repository version 2) successfully, password is correct
created new cache in /root/.cache/restic
no parent snapshot found, will read all files

Files:        5934 new,     0 changed,     0 unmodified
Dirs:         1622 new,     0 changed,     0 unmodified
Added to the repository: 1.570 GiB (1.167 GiB stored)

processed 5934 files, 1.694 GiB in 0:20
snapshot 0b11f778 saved

$ restic snapshots               # 查看备份快照
repository fcd37256 opened (repository version 2) successfully, password is correct
ID        Time                 Host        Tags        Paths
------------------------------------------------------------------
0b11f778  2025-03-19 15:25:21  pigsty.cc               /www/web.cc
------------------------------------------------------------------
1 snapshots

$ restic backup /www/web.cc
repository fcd37256 opened (repository version 2) successfully, password is correct
using parent snapshot 0b11f778

Files:           0 new,     0 changed,  5934 unmodified
Dirs:            0 new,     0 changed,  1622 unmodified
Added to the repository: 0 B   (0 B   stored)

processed 5934 files, 1.694 GiB in 0:00
snapshot 06cd9b5c saved

[03-19 15:25:59] root@pigsty.cc:/data/backups
$ restic snapshots               # 查看备份快照
repository fcd37256 opened (repository version 2) successfully, password is correct
ID        Time                 Host        Tags        Paths
------------------------------------------------------------------
0b11f778  2025-03-19 15:25:21  pigsty.cc               /www/web.cc
06cd9b5c  2025-03-19 15:25:58  pigsty.cc               /www/web.cc
------------------------------------------------------------------
2 snapshots

$ restic restore -t /www/web.cc 0b11f778
repository fcd37256 opened (repository version 2) successfully, password is correct
restoring <Snapshot 0b11f778 of [/www/web.cc] at 2025-03-19 15:25:21.514089814 +0800 HKT by root@pigsty.cc> to /www/web.cc
使用对象存储
你可以使用 许许多多的方式来存储 Restic 的备份数据。这里介绍如何使用 Pigsty 自带的 MinIO 作为备份仓库。
export AWS_ACCESS_KEY_ID=minioadmin              # MinIO 默认账号
export AWS_SECRET_ACCESS_KEY=minioadmin          # MinIO 默认密码
restic -r s3:http://sss.pigsty:9000/infra init   # 利用默认的 infra 桶作为备份目的地
14 - JuiceFS:分布式文件系统
JuiceFS 是一个高性能、云原生分布式文件系统,
本文介绍如何使用 Pigsty 提供的 PostgreSQL 作为 JuiceFS 的元数据引擎,MinIO 作为 JuiceFS 的对象存储引擎,搭建一套生产级 JuiceFS 集群。
快速上手
使用 full 模式创建四节点沙箱。
./configure -c full
./install.yml
安装 JuiceFS 并使用对象存储:
JFSNAME=jfs
METAURL=postgres://dbuser_meta:DBUser.Meta@10.10.10.10:5432/meta
DATAURL=(
  --storage minio
  --bucket https://sss.pigsty:9000/infra
  --access-key minioadmin
  --secret-key minioadmin
)

juicefs format "${DATAURL[@]}" ${METAURL} jfs    # 格式化文件系统
juicefs mount ${METAURL} ~/jfs -d                # 后台挂载
juicefs umount ~/jfs                             # 停止挂载
更狂野的玩法:PGFS,把数据库当成文件系统用
JFSNAME=jfs
METAURL=postgres://dbuser_meta:DBUser.Meta@10.10.10.10:5432/meta
DATAURL=(
  --storage postgres
  --bucket 10.10.10.10:5432/meta
  --access-key dbuser_meta
  --secret-key DBUser.Meta
)

juicefs format "${DATAURL[@]}" ${METAURL} ${JFSNAME}
juicefs mount ${METAURL} ~/jfs -d                # 后台挂载
juicefs umount ~/jfs                             # 停止挂载
单机模式
Pigsty Infra 仓库提供最新版本的 JuiceFS RPM/DEB 包,直接使用包管理器安装即可。
以下命令使用本地 SQLite 与文件系统(/var/jfs) 创建一个本地 JuiceFS 文件系统:
juicefs format sqlite3:///tmp/jfs.db myjfs
格式化输出
$ juicefs format sqlite3:///jfs.db myjfs
2025/03/19 12:07:56.956222 juicefs[62924] <INFO>: Meta address: sqlite3:///jfs.db [interface.go:504]
2025/03/19 12:07:56.958055 juicefs[62924] <INFO>: Data use file:///var/jfs/myjfs/ [format.go:484]
2025/03/19 12:07:56.966150 juicefs[62924] <INFO>: Volume is formatted as {
  "Name": "myjfs",
  "UUID": "1568ee2a-dc4c-4a0e-9788-be0490776dda",
  "Storage": "file",
  "Bucket": "/var/jfs/",
  "BlockSize": 4096,
  "Compression": "none",
  "EncryptAlgo": "aes256gcm-rsa",
  "TrashDays": 1,
  "MetaVersion": 1,
  "MinClientVersion": "1.1.0-A",
  "DirStats": true,
  "EnableACL": false
} [format.go:521]
然后使用以下命令进行本地前台挂载:
juicefs mount sqlite3:///tmp/jfs.db ~/jfs      # 前台挂载,退出后自动卸载
juicefs mount sqlite3:///tmp/jfs.db ~/jfs -d   # 守护进程挂载,需要手动卸载
juicefs umount ~/jfs                           # 取消挂载,退出进程
删除数据
使用以下命令清空 PostgreSQL 中的 JuiceFS 元数据
DROP TABLE IF EXISTS jfs_acl,jfs_chunk,jfs_chunk_ref,jfs_counter,jfs_delfile,jfs_delslices,jfs_detached_node,jfs_dir_quota,jfs_dir_stats,jfs_edge,jfs_flock,jfs_node,jfs_plock,jfs_session2,jfs_setting,jfs_sustained,jfs_symlink,jfs_xattr CASCADE;
使用以下命令清空对象存储桶:
mcli rm --recursive --force infra/jfs
PGFS性能摘要
二手物理机评测结果:
METAURL=postgres://dbuser_meta:DBUser.Meta@:5432/meta
OPTIONS=(
  --storage postgres
  --bucket :5432/meta
  --access-key dbuser_meta
  --secret-key DBUser.Meta
  ${METAURL}
  jfs
)

juicefs format "${OPTIONS[@]}"
juicefs mount ${METAURL} ~/jfs -d  # 后台挂载
juicefs bench ~/jfs                # 测试性能
juicefs umount ~/jfs               # 停止挂载
$ juicefs bench ~/jfs                # 测试性能
  Write big blocks: 1024/1024 [==============================================================]  178.5/s  used: 5.73782533s
   Read big blocks: 1024/1024 [==============================================================]  31.7/s   used: 32.314547037s
Write small blocks: 100/100 [==============================================================]  149.2/s  used: 670.127171ms
 Read small blocks: 100/100 [==============================================================]  543.4/s  used: 184.109596ms
  Stat small files: 100/100 [==============================================================]  1723.4/s used: 58.087752ms
Benchmark finished!
BlockSize: 1.0 MiB, BigFileSize: 1.0 GiB, SmallFileSize: 128 KiB, SmallFileCount: 100, NumThreads: 1
Time used: 42.2 s, CPU: 687.2%, Memory: 179.4 MiB
+------------------+------------------+---------------+
|       ITEM       |       VALUE      |      COST     |
+------------------+------------------+---------------+
|   Write big file |     178.51 MiB/s |   5.74 s/file |
|    Read big file |      31.69 MiB/s |  32.31 s/file |
| Write small file |    149.4 files/s |  6.70 ms/file |
|  Read small file |    545.2 files/s |  1.83 ms/file |
|        Stat file |   1749.7 files/s |  0.57 ms/file |
|   FUSE operation | 17869 operations |    3.82 ms/op |
|      Update meta |  1164 operations |    1.09 ms/op |
|       Put object |   356 operations |  303.01 ms/op |
|       Get object |   256 operations | 1072.82 ms/op |
|    Delete object |     0 operations |    0.00 ms/op |
| Write into cache |   356 operations |    2.18 ms/op |
|  Read from cache |   100 operations |    0.11 ms/op |
+------------------+------------------+---------------+
15 - 便宜VPS
如你所见,本站托管在 阿爪云 “Claw Cloud” 上,这是位于新加坡的 “阿里云青春版”。
小道消息称:这是阿里云在新加坡开的马甲
我用的是一台 4c8g / 200g 磁盘,1Gbps 带宽,每月 2TB 流量的中国优化云服务器,每月 18 $,托管在 HK 可用区。
相比 阿里云/腾讯云/AWS 卖的那些 EC2 要便宜多了,特别是流量。国内 1GB 八毛钱简直是抢劫。
这玩意大陆访问还挺快,香港地区大概 ping 50ms,所以我就拿来建站了,同时还跑着 Pigsty 的 Demo。
如果你要弄一台建个站或者搭个 TZ,不妨考虑一下这个,以下推荐码链接可以立省 10%,我也赚个返点贴补服务器费用:
当然,如果你想要支持本项目的发展,也可以选择更直接的方式:

扫描支付宝二维码,感谢您的支持 🙏