This is the multi-page printable view of this section.
Click here to print.
Return to the regular view of this page.
Data Visualization Applet
使用 Pigsty Grafana & Echarts 工具箱进行数据分析与可视化
Applet的结构
Applet,是一种自包含的,运行于Pigsty基础设施中的数据小应用。
一个Pigsty应用通常包括以下内容中的至少一样或全部:
- 图形界面(Grafana Dashboard定义) 放置于
ui目录
- 数据定义(PostgreSQL DDL File),放置于
sql 目录
- 数据文件(各类资源,需要下载的文件),放置于
data目录
- 逻辑脚本(执行各类逻辑),放置于
bin目录
Pigsty默认提供了几个样例应用:
pglog, 分析PostgreSQL CSV日志样本。covid, 可视化WHO COVID-19数据,查阅各国疫情数据。pglog, NOAA ISD,可以查询全球30000个地表气象站从1901年来的气象观测记录。
应用的结构
一个Pigsty应用会在应用根目录提供一个安装脚本:install或相关快捷方式。您需要使用管理用户在 管理节点 执行安装。安装脚本会检测当前的环境(获取 METADB_URL, PIGSTY_HOME,GRAFANA_ENDPOINT等信息以执行安装)
通常,带有APP标签的面板会被列入Pigsty Grafana首页导航中App下拉菜单中,带有APP和Overview标签的面板则会列入首页面板导航中。
您可以从 https://github.com/Vonng/pigsty/releases/download/v1.5.1/app.tgz 下载带有基础数据的应用进行安装。
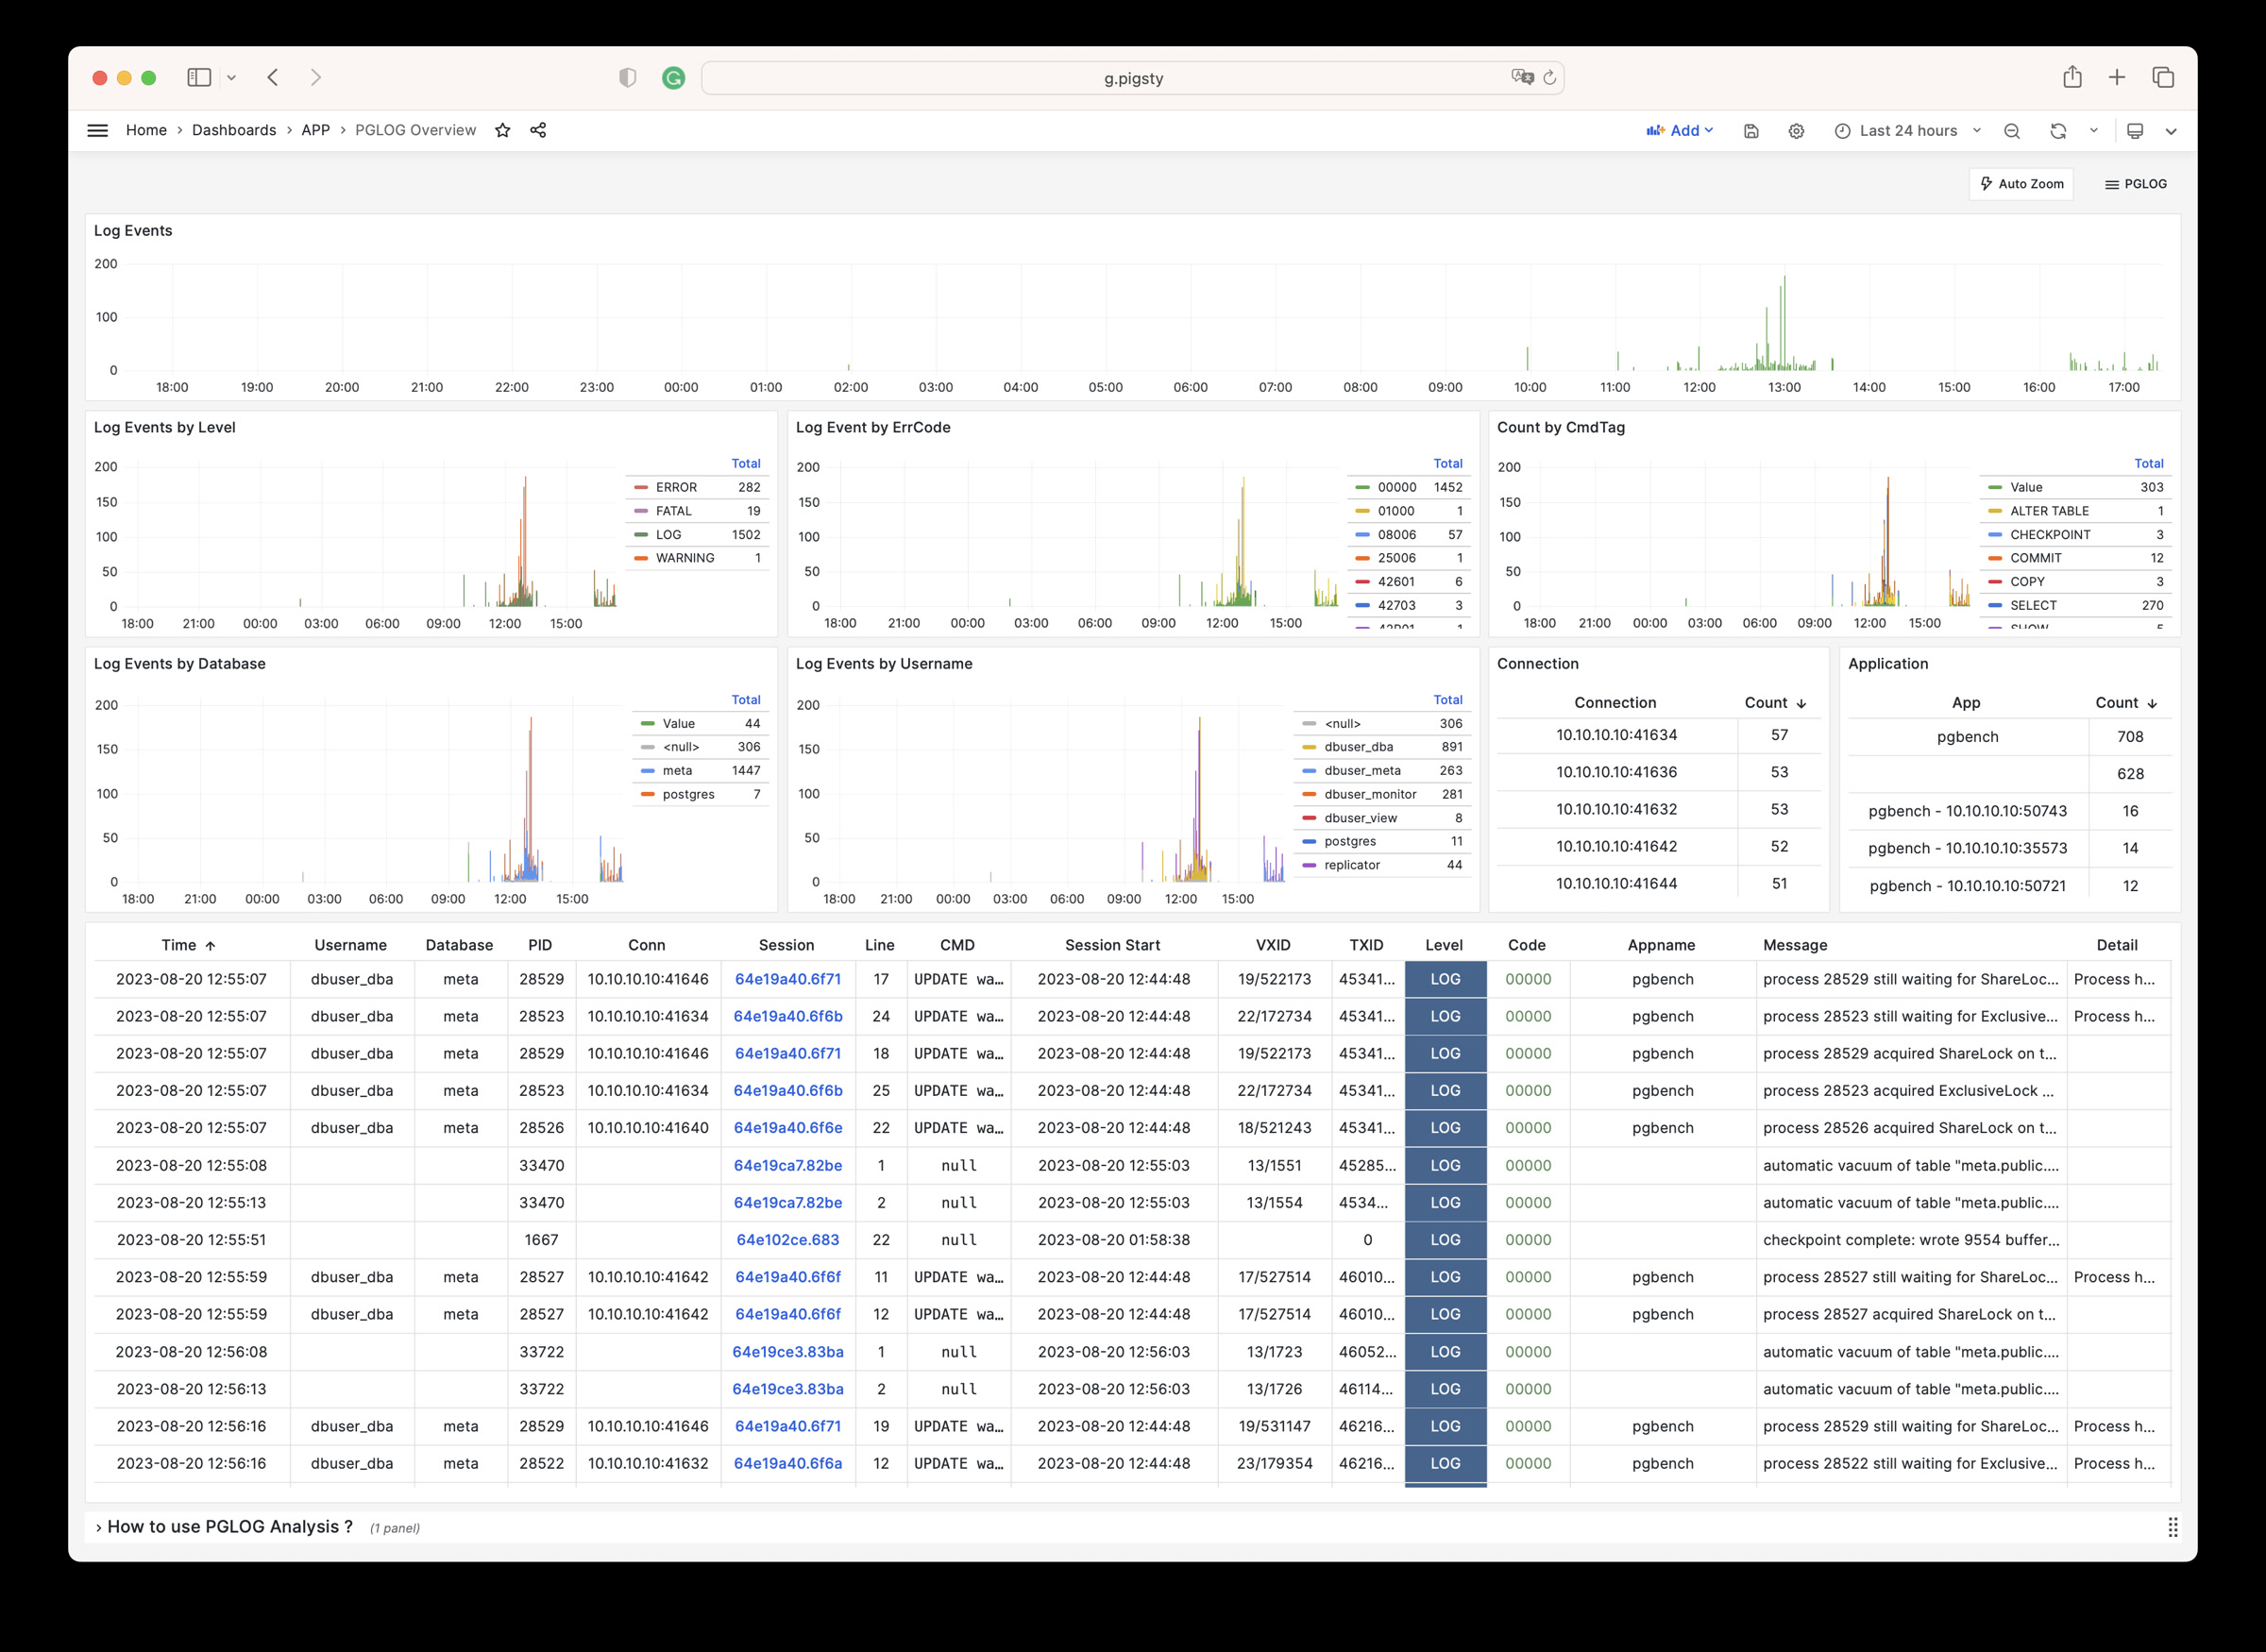
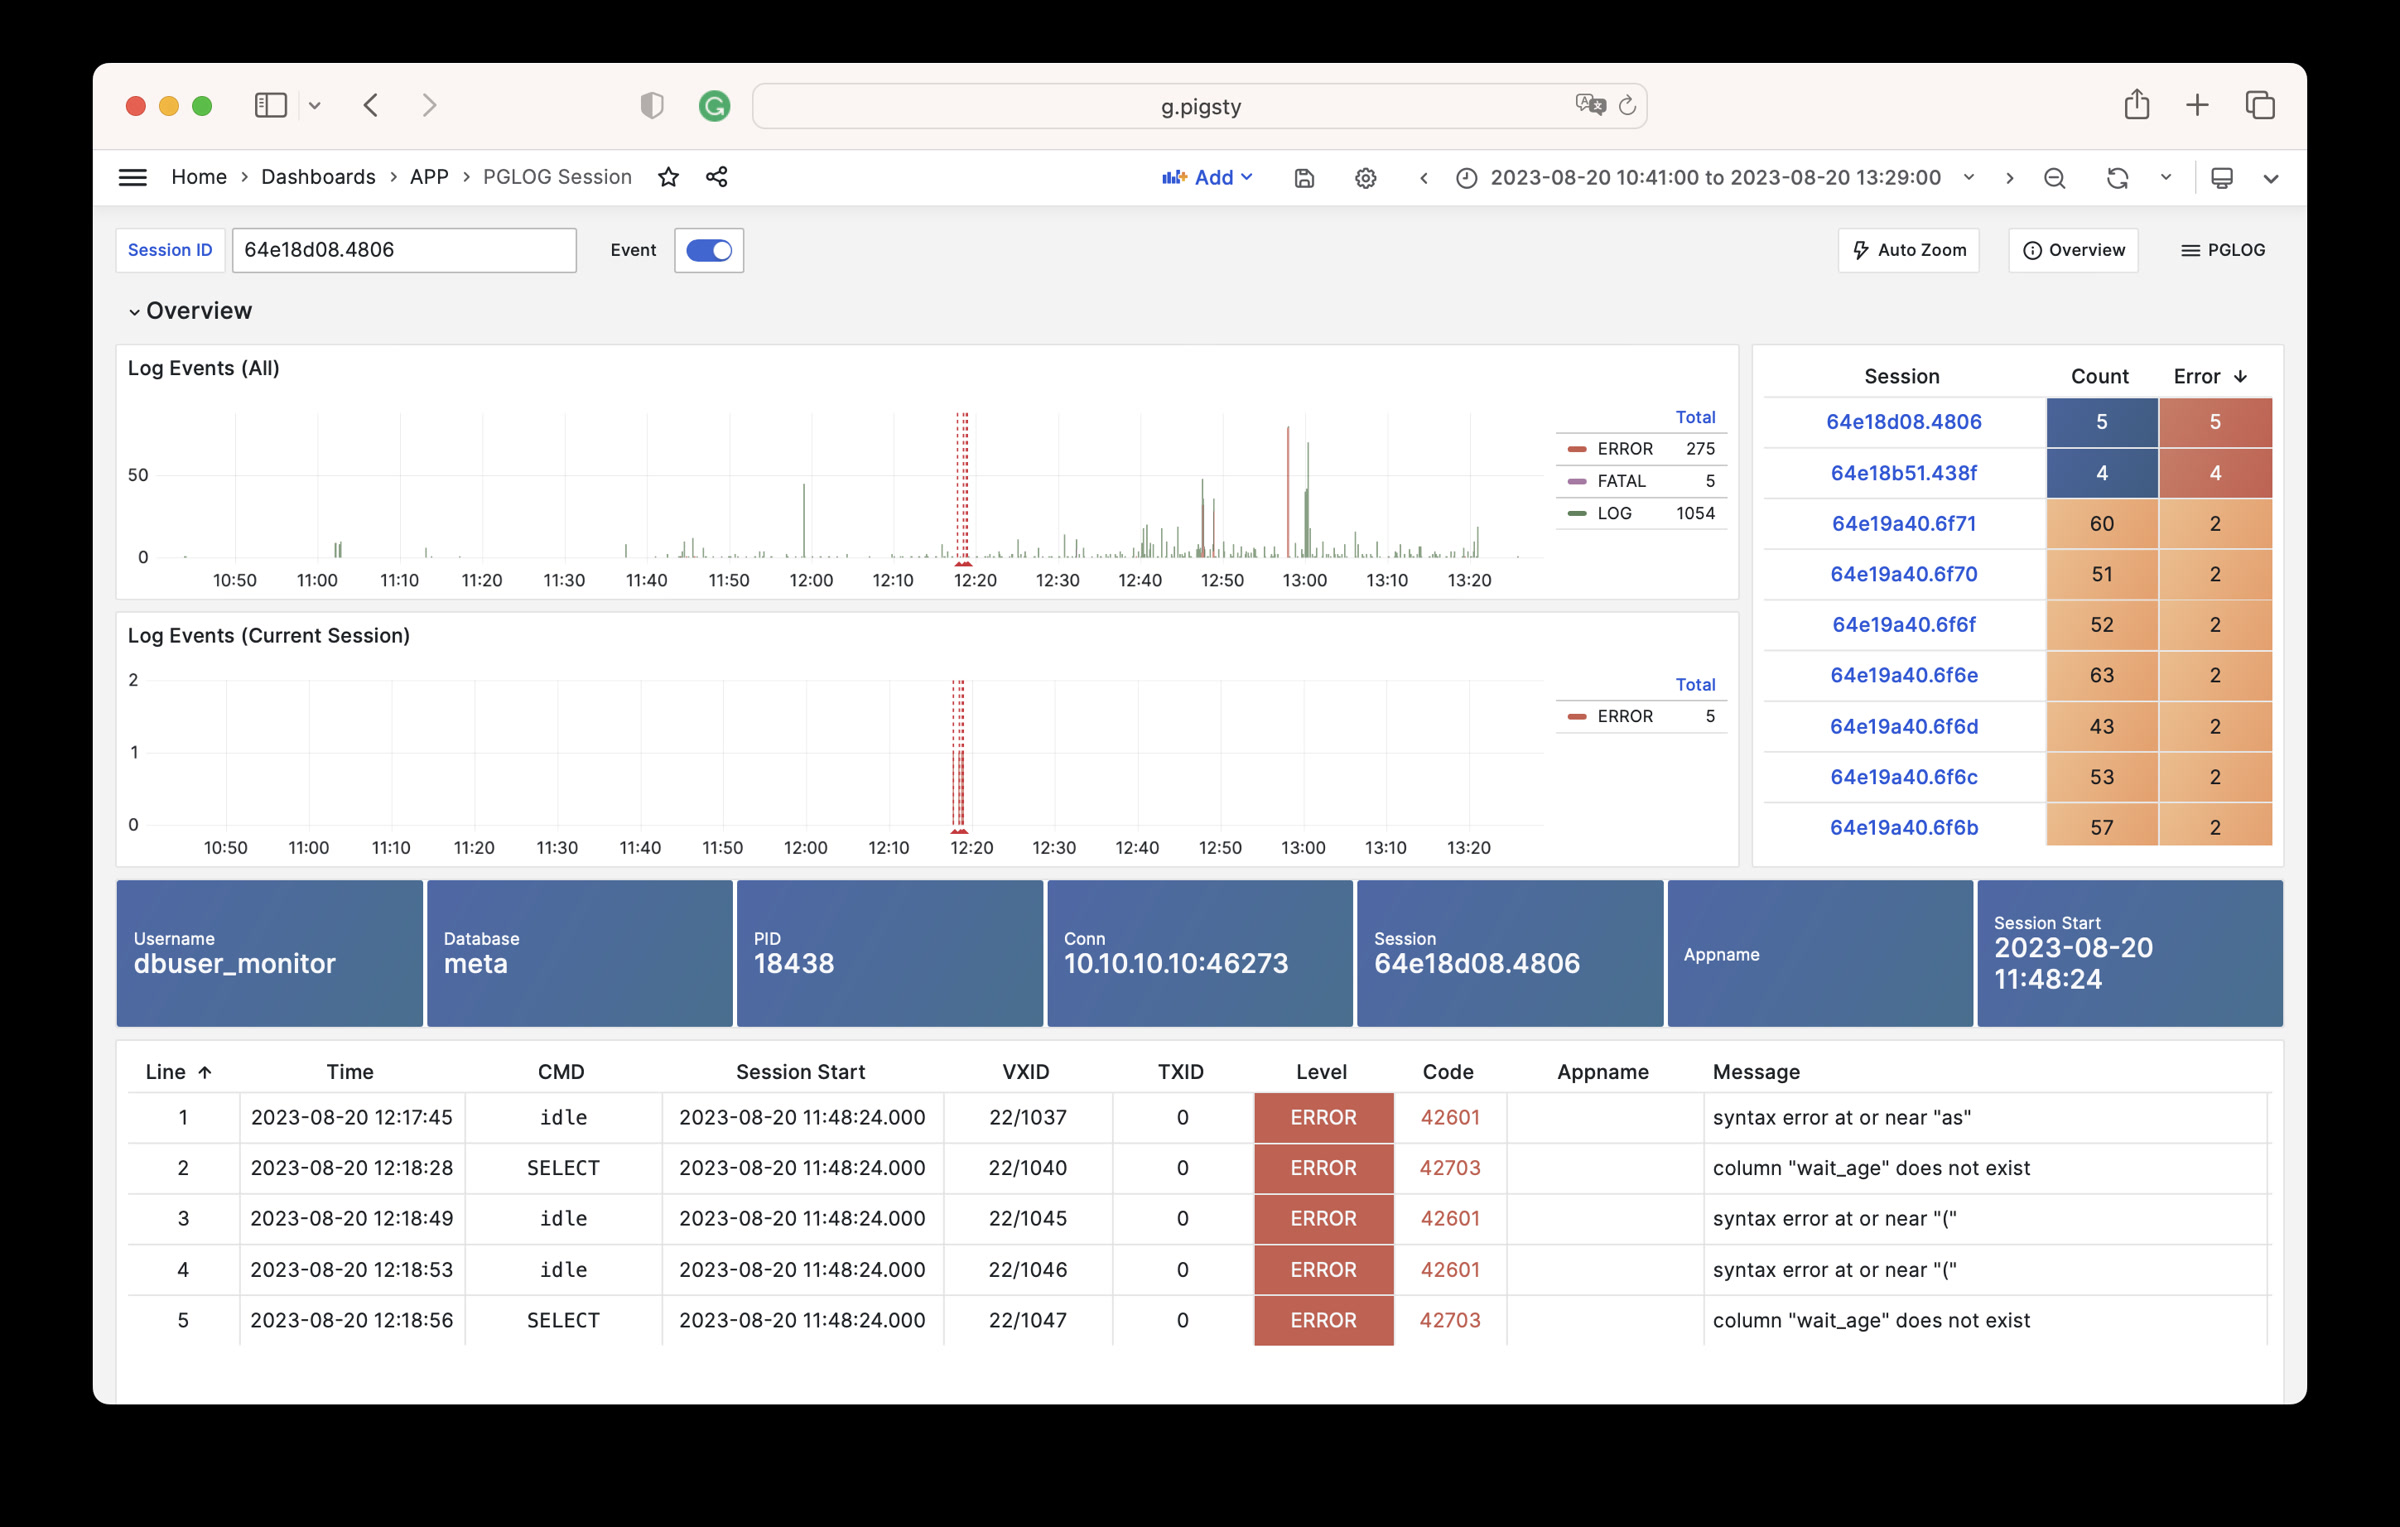
1 - Analyse CSVLOG Sample with the built-in PGLOG
Analyse CSVLOG Sample with the built-in PGLOG
PGLOG是Pigsty自带的一个样例应用,固定使用MetaDB中pglog.sample表作为数据来源。您只需要将日志灌入该表,然后访问相关Dashboard即可。
Pigsty提供了一些趁手的命令,用于拉取csv日志,并灌入样本表中。在元节点上,默认提供下列快捷命令:
catlog  [node=localhost]  [date=today]   # 打印CSV日志到标准输出
pglog                                    # 从标准输入灌入CSVLOG
pglog12                                  # 灌入PG12格式的CSVLOG
pglog13                                  # 灌入PG13格式的CSVLOG
pglog14                                  # 灌入PG14格式的CSVLOG (=pglog)

catlog | pglog                       # 分析当前节点当日的日志
catlog node-1 '2021-07-15' | pglog   # 分析node-1在2021-07-15的csvlog
接下来,您可以访问以下的连接,查看样例日志分析界面。
catlog命令从特定节点拉取特定日期的CSV数据库日志,写入stdout
默认情况下,catlog会拉取当前节点当日的日志,您可以通过参数指定节点与日期。
组合使用pglog与catlog,即可快速拉取数据库CSV日志进行分析。
catlog | pglog                       # 分析当前节点当日的日志
catlog node-1 '2021-07-15' | pglog   # 分析node-1在2021-07-15的csvlog
2 - NOAA ISD Station
Fetch, Parse, Analyze, and Visualize Integrated Surface Weather Station Dataset
Including 30000 meteorology station, daily, sub-hourly observation records, from 1900-2023. https://github.com/Vonng/isd

It is recommended to use with Pigsty, the battery-included PostgreSQL distribution with Grafana & echarts for visualization. It will setup everything for your with make all;
Otherwise, you’ll have to provide your own PostgreSQL instance, and setup grafana dashboards manually.
Quick Start
Clone this repo
git clone https://github.com/Vonng/isd.git; cd isd;
Prepare a PostgreSQL Instance
Export PGURL in your environment to specify the target postgres database:
# the default PGURL for pigsty's meta database, change that accordingly
export PGURL=postgres://dbuser_dba:DBUser.DBA@127.0.0.1:5432/meta?sslmode=disable
psql "${PGURL}" -c 'SELECT 1'  # check if connection is ok
then init database schema with:
make sql # setup postgres schema on target database
Get isd station metadata
The basic station metadata can be downloaded and loaded with:
make reload-station # equivalent to get-station + load-station
Fetch and load isd.daily
To load isd.daily dataset, which is organized by yearly tarball files.
You can download the raw data from noaa and parse with isd parser
make get-parser       # download parser binary from github, you can just build with: make build
make reload-daily     # download and reload latest daily data and re-calculates monthly/yearly data
Load Parsed Stable CSV Data
Or just load the pre-parsed stable part from GitHub.
Which is well-formatted CSV that does not require an isd parser.
make get-stable       # download stable isd.daily dataset from Github
make load-stable      # load downloaded stable isd.daily dataset into database
More Data
There are two parts of isd datasets needs to be regularly updated: station metadata & isd.daily of the latest year, you can reload them with:
make reload # reload-station + reload-daily
You can download and load isd.daily in a specific year with:
bin/get-daily  2022                   # get daily observation summary of a specific year (1900-2023)
bin/load-daily "${PGURL}" 2022    # load daily data of a specific year
You can also download and load isd.hourly in a specific year with:
bin/get-hourly  2022                  # get hourly observation record of a specific year (1900-2023)
bin/load-hourly "${PGURL}" 2022   # load hourly data of a specific year
Data
Dataset
There are four official datasets
Daily Dataset
- Tarball size 2.8GB (until 2023-06-24)
- Table size 24GB, Index size 6GB, Total size in PostgreSQL = 30GB
- If timescaledb compression is used, it will be compressed to around 4.5GB
Hourly dataset
- Tarball size 117GB
- Table size 1TB+ , Index size 600GB+
Schema
CREATE TABLE isd.station
(
    station    VARCHAR(12) PRIMARY KEY,
    usaf       VARCHAR(6) GENERATED ALWAYS AS (substring(station, 1, 6)) STORED,
    wban       VARCHAR(5) GENERATED ALWAYS AS (substring(station, 7, 5)) STORED,
    name       VARCHAR(32),
    country    VARCHAR(2),
    province   VARCHAR(2),
    icao       VARCHAR(4),
    location   GEOMETRY(POINT),
    longitude  NUMERIC GENERATED ALWAYS AS (Round(ST_X(location)::NUMERIC, 6)) STORED,
    latitude   NUMERIC GENERATED ALWAYS AS (Round(ST_Y(location)::NUMERIC, 6)) STORED,
    elevation  NUMERIC,
    period     daterange,
    begin_date DATE GENERATED ALWAYS AS (lower(period)) STORED,
    end_date   DATE GENERATED ALWAYS AS (upper(period)) STORED
);
CREATE TABLE IF NOT EXISTS isd.daily
(
    station     VARCHAR(12) NOT NULL, -- station number 6USAF+5WBAN
    ts          DATE        NOT NULL, -- observation date
    -- temperature & dew point
    temp_mean   NUMERIC(3, 1),        -- mean temperature ℃
    temp_min    NUMERIC(3, 1),        -- min temperature ℃
    temp_max    NUMERIC(3, 1),        -- max temperature ℃
    dewp_mean   NUMERIC(3, 1),        -- mean dew point ℃
    -- pressure
    slp_mean    NUMERIC(5, 1),        -- sea level pressure (hPa)
    stp_mean    NUMERIC(5, 1),        -- station pressure (hPa)
    -- visible distance
    vis_mean    NUMERIC(6),           -- visible distance (m)
    -- wind speed
    wdsp_mean   NUMERIC(4, 1),        -- average wind speed (m/s)
    wdsp_max    NUMERIC(4, 1),        -- max wind speed (m/s)
    gust        NUMERIC(4, 1),        -- max wind gust (m/s)
    -- precipitation / snow depth
    prcp_mean   NUMERIC(5, 1),        -- precipitation (mm)
    prcp        NUMERIC(5, 1),        -- rectified precipitation (mm)
    sndp        NuMERIC(5, 1),        -- snow depth (mm)
    -- FRSHTT (Fog/Rain/Snow/Hail/Thunder/Tornado)
    is_foggy    BOOLEAN,              -- (F)og
    is_rainy    BOOLEAN,              -- (R)ain or Drizzle
    is_snowy    BOOLEAN,              -- (S)now or pellets
    is_hail     BOOLEAN,              -- (H)ail
    is_thunder  BOOLEAN,              -- (T)hunder
    is_tornado  BOOLEAN,              -- (T)ornado or Funnel Cloud
    -- record count
    temp_count  SMALLINT,             -- record count for temp
    dewp_count  SMALLINT,             -- record count for dew point
    slp_count   SMALLINT,             -- record count for sea level pressure
    stp_count   SMALLINT,             -- record count for station pressure
    wdsp_count  SMALLINT,             -- record count for wind speed
    visib_count SMALLINT,             -- record count for visible distance
    -- temp marks
    temp_min_f  BOOLEAN,              -- aggregate min temperature
    temp_max_f  BOOLEAN,              -- aggregate max temperature
    prcp_flag   CHAR,                 -- precipitation flag: ABCDEFGHI
    PRIMARY KEY (station, ts)
); -- PARTITION BY RANGE (ts);
ISD Hourly
CREATE TABLE IF NOT EXISTS isd.hourly
(
    station    VARCHAR(12) NOT NULL, -- station id
    ts         TIMESTAMP   NOT NULL, -- timestamp
    -- air
    temp       NUMERIC(3, 1),        -- [-93.2,+61.8]
    dewp       NUMERIC(3, 1),        -- [-98.2,+36.8]
    slp        NUMERIC(5, 1),        -- [8600,10900]
    stp        NUMERIC(5, 1),        -- [4500,10900]
    vis        NUMERIC(6),           -- [0,160000]
    -- wind
    wd_angle   NUMERIC(3),           -- [1,360]
    wd_speed   NUMERIC(4, 1),        -- [0,90]
    wd_gust    NUMERIC(4, 1),        -- [0,110]
    wd_code    VARCHAR(1),           -- code that denotes the character of the WIND-OBSERVATION.
    -- cloud
    cld_height NUMERIC(5),           -- [0,22000]
    cld_code   VARCHAR(2),           -- cloud code
    -- water
    sndp       NUMERIC(5, 1),        -- mm snow
    prcp       NUMERIC(5, 1),        -- mm precipitation
    prcp_hour  NUMERIC(2),           -- precipitation duration in hour
    prcp_code  VARCHAR(1),           -- precipitation type code
    -- sky
    mw_code    VARCHAR(2),           -- manual weather observation code
    aw_code    VARCHAR(2),           -- auto weather observation code
    pw_code    VARCHAR(1),           -- weather code of past period of time
    pw_hour    NUMERIC(2),           -- duration of pw_code period
    -- misc
    -- remark     TEXT,
    -- eqd        TEXT,
    data       JSONB                 -- extra data
) PARTITION BY RANGE (ts);
Parser
There are two parsers: isdd and isdh, which takes noaa original yearly tarball as input, generate CSV as output (which could be directly consumed by PostgreSQL COPY command).
NAME
        isd -- Intergrated Surface Dataset Parser

SYNOPSIS
        isd daily   [-i <input|stdin>] [-o <output|stout>] [-v]
        isd hourly  [-i <input|stdin>] [-o <output|stout>] [-v] [-d raw|ts-first|hour-first]

DESCRIPTION
        The isd program takes noaa isd daily/hourly raw tarball data as input.
        and generate parsed data in csv format as output. Works in pipe mode

        cat data/daily/2023.tar.gz | bin/isd daily -v | psql ${PGURL} -AXtwqc "COPY isd.daily FROM STDIN CSV;"

        isd daily  -v -i data/daily/2023.tar.gz  | psql ${PGURL} -AXtwqc "COPY isd.daily FROM STDIN CSV;"
        isd hourly -v -i data/hourly/2023.tar.gz | psql ${PGURL} -AXtwqc "COPY isd.hourly FROM STDIN CSV;"

OPTIONS
        -i  <input>     input file, stdin by default
        -o  <output>    output file, stdout by default
        -p  <profpath>  pprof file path, enable if specified
        -d              de-duplicate rows for hourly dataset (raw, ts-first, hour-first)
        -v              verbose mode
        -h              print help
UI
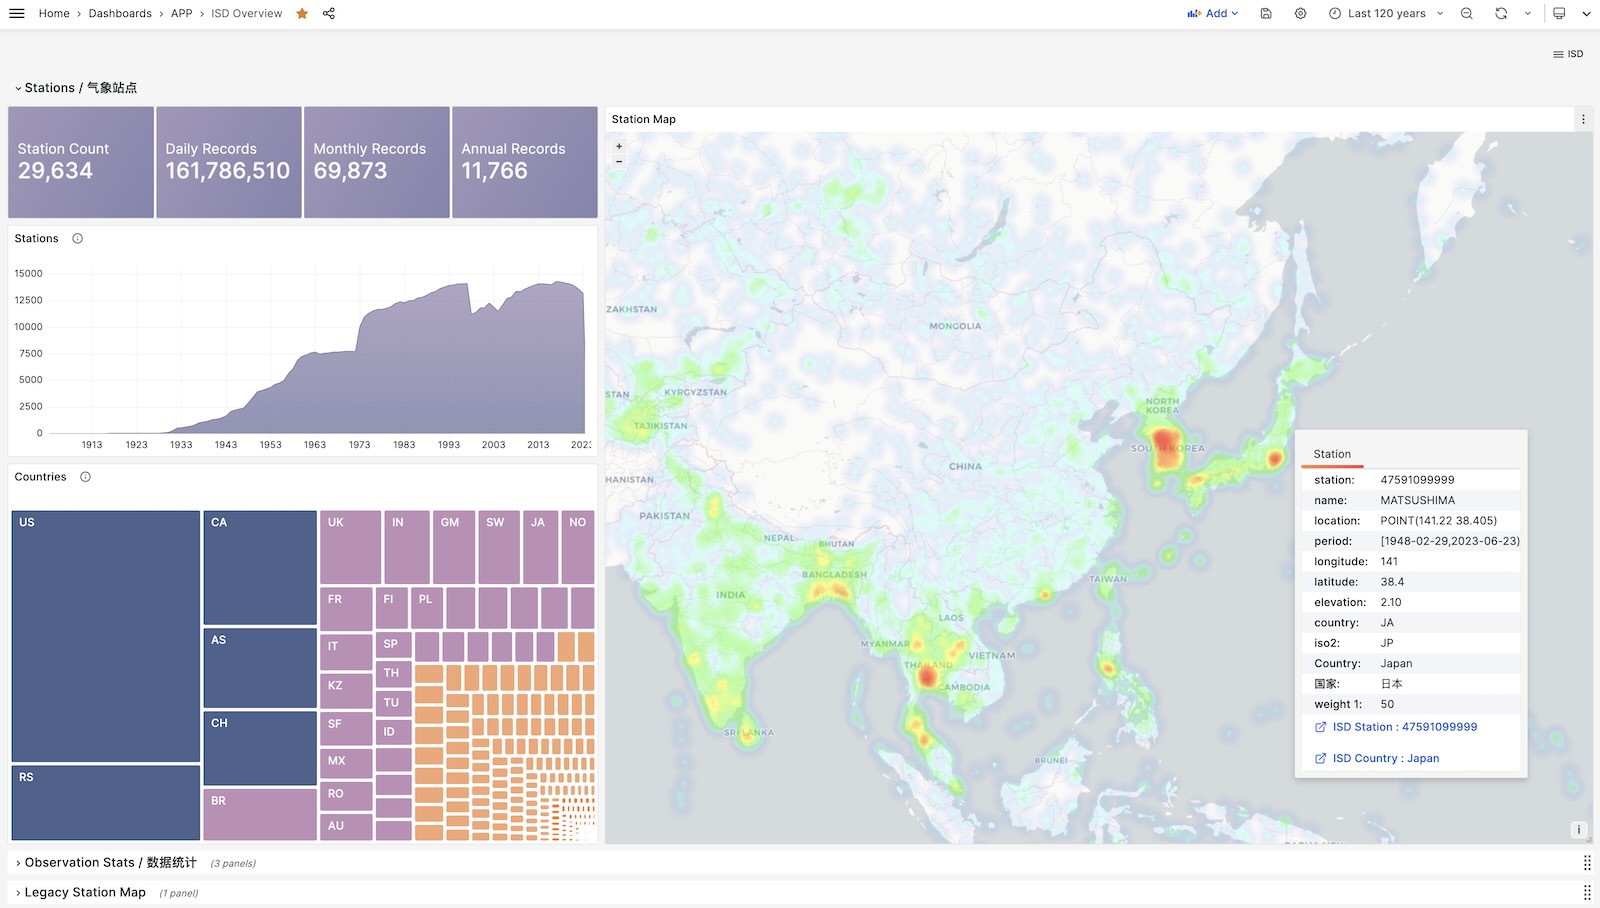
ISD Overview
Show all stations on a world map.
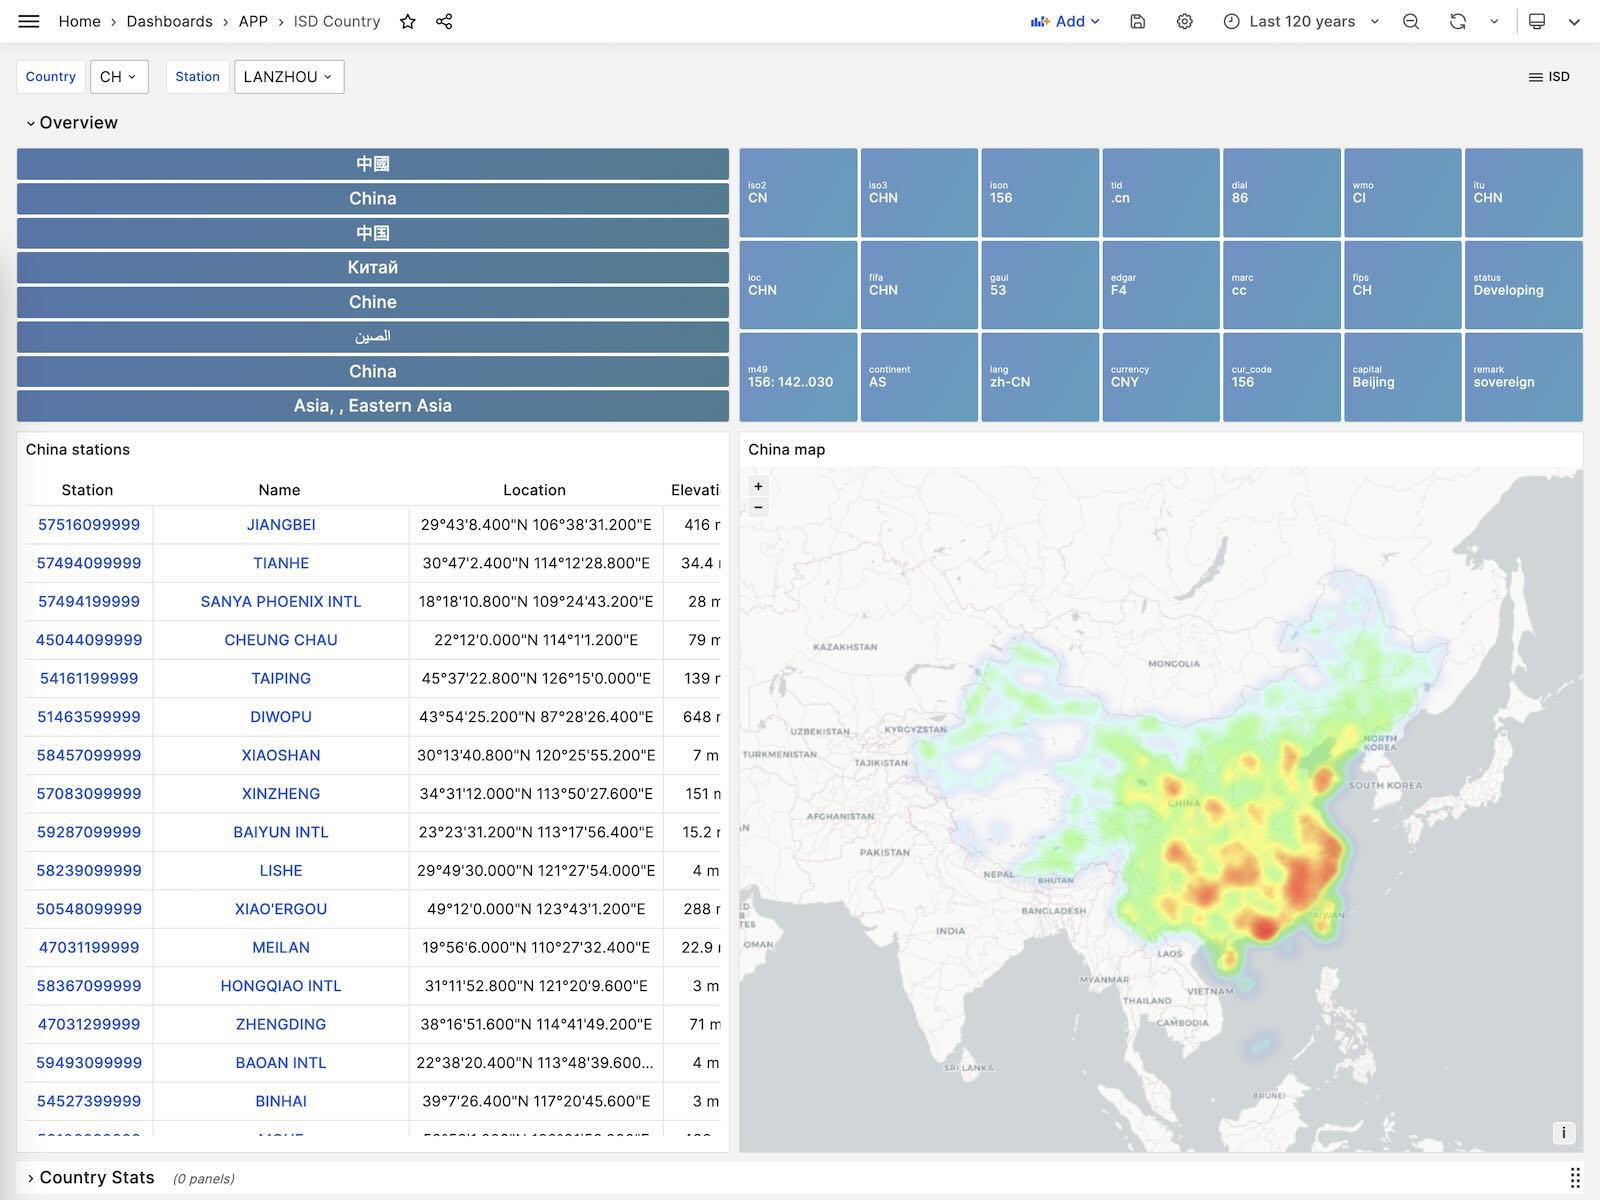
ISD Country
Show all stations among a country.
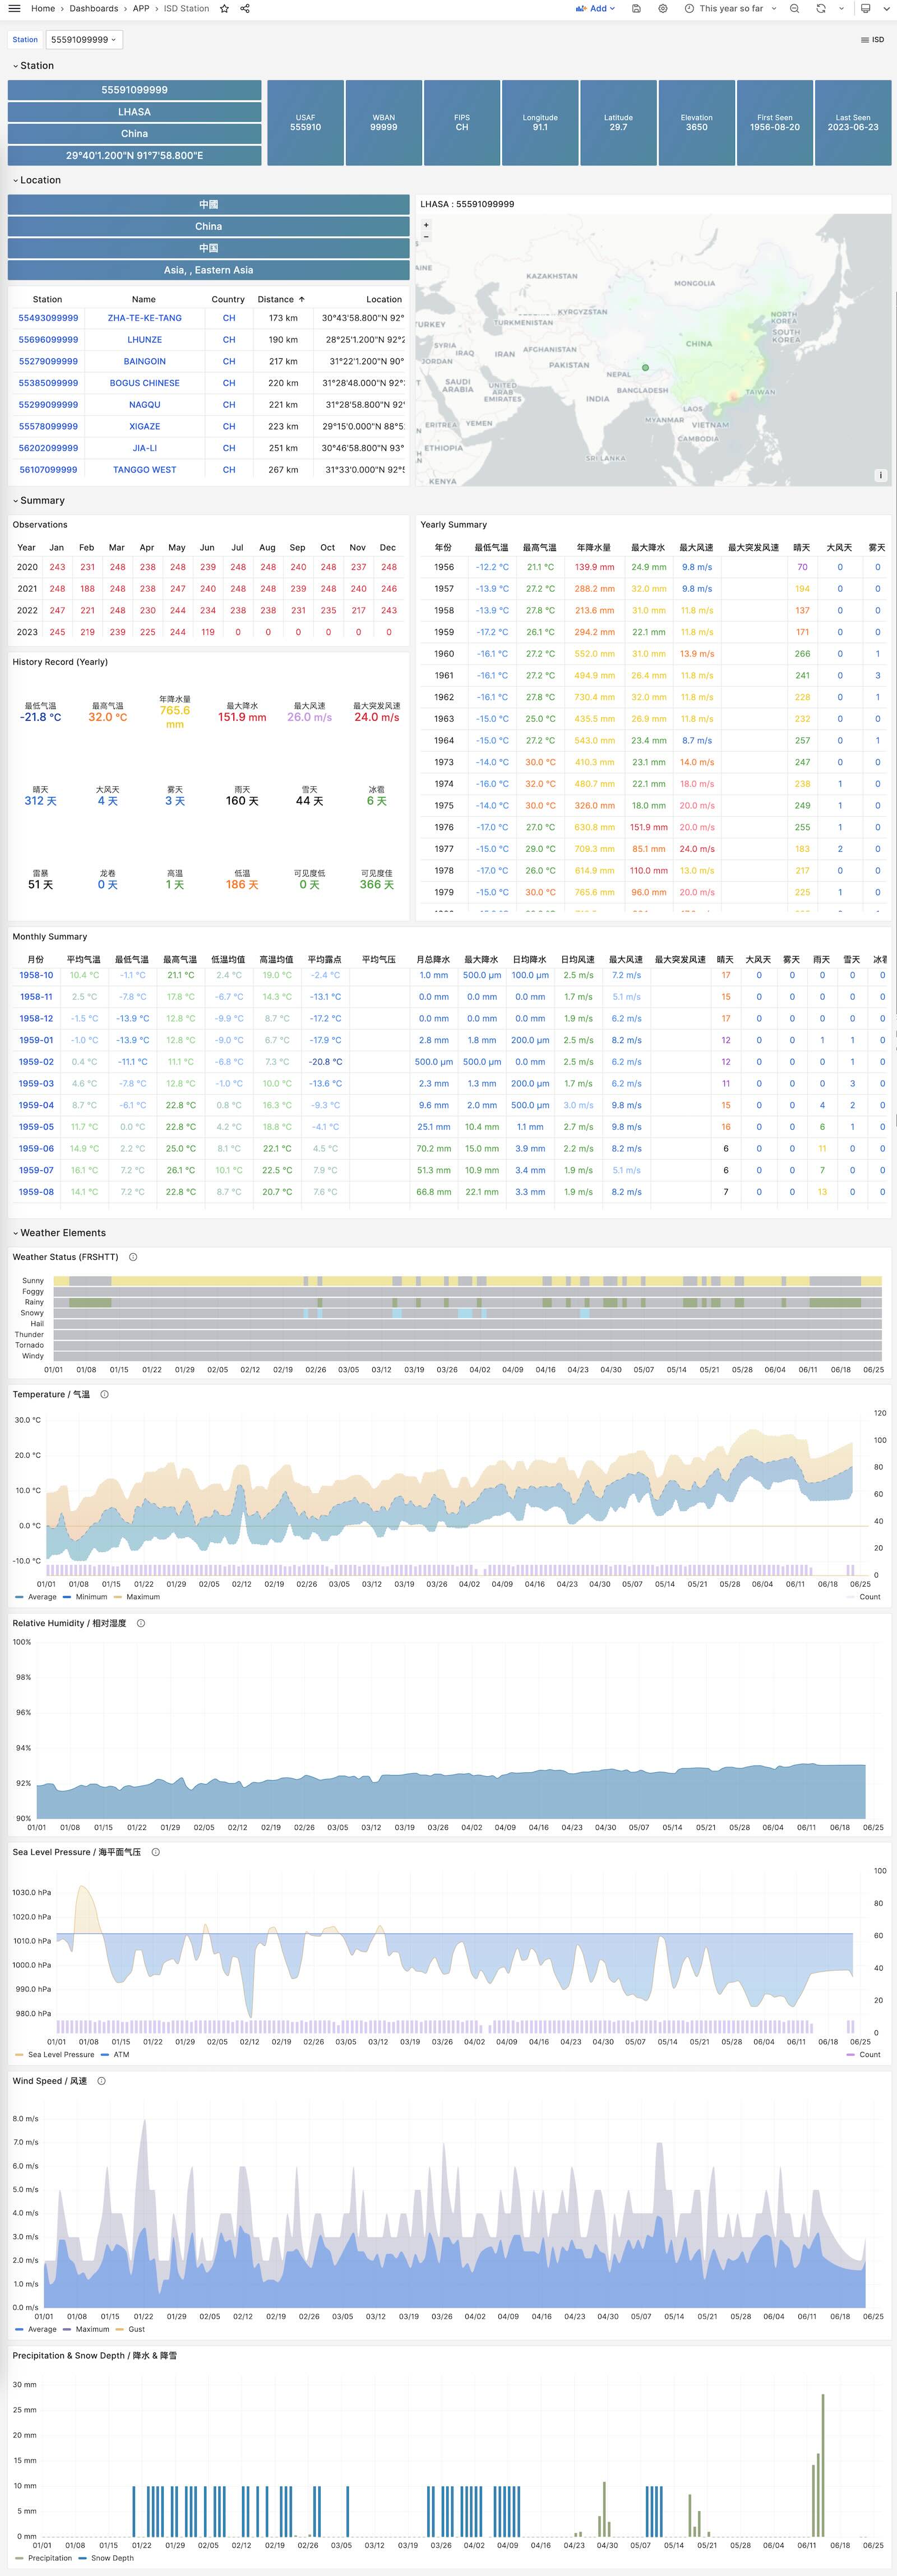
ISD Station
Visualize station metadata and daily/monthly/yearly summary
ISD Station Dashboard
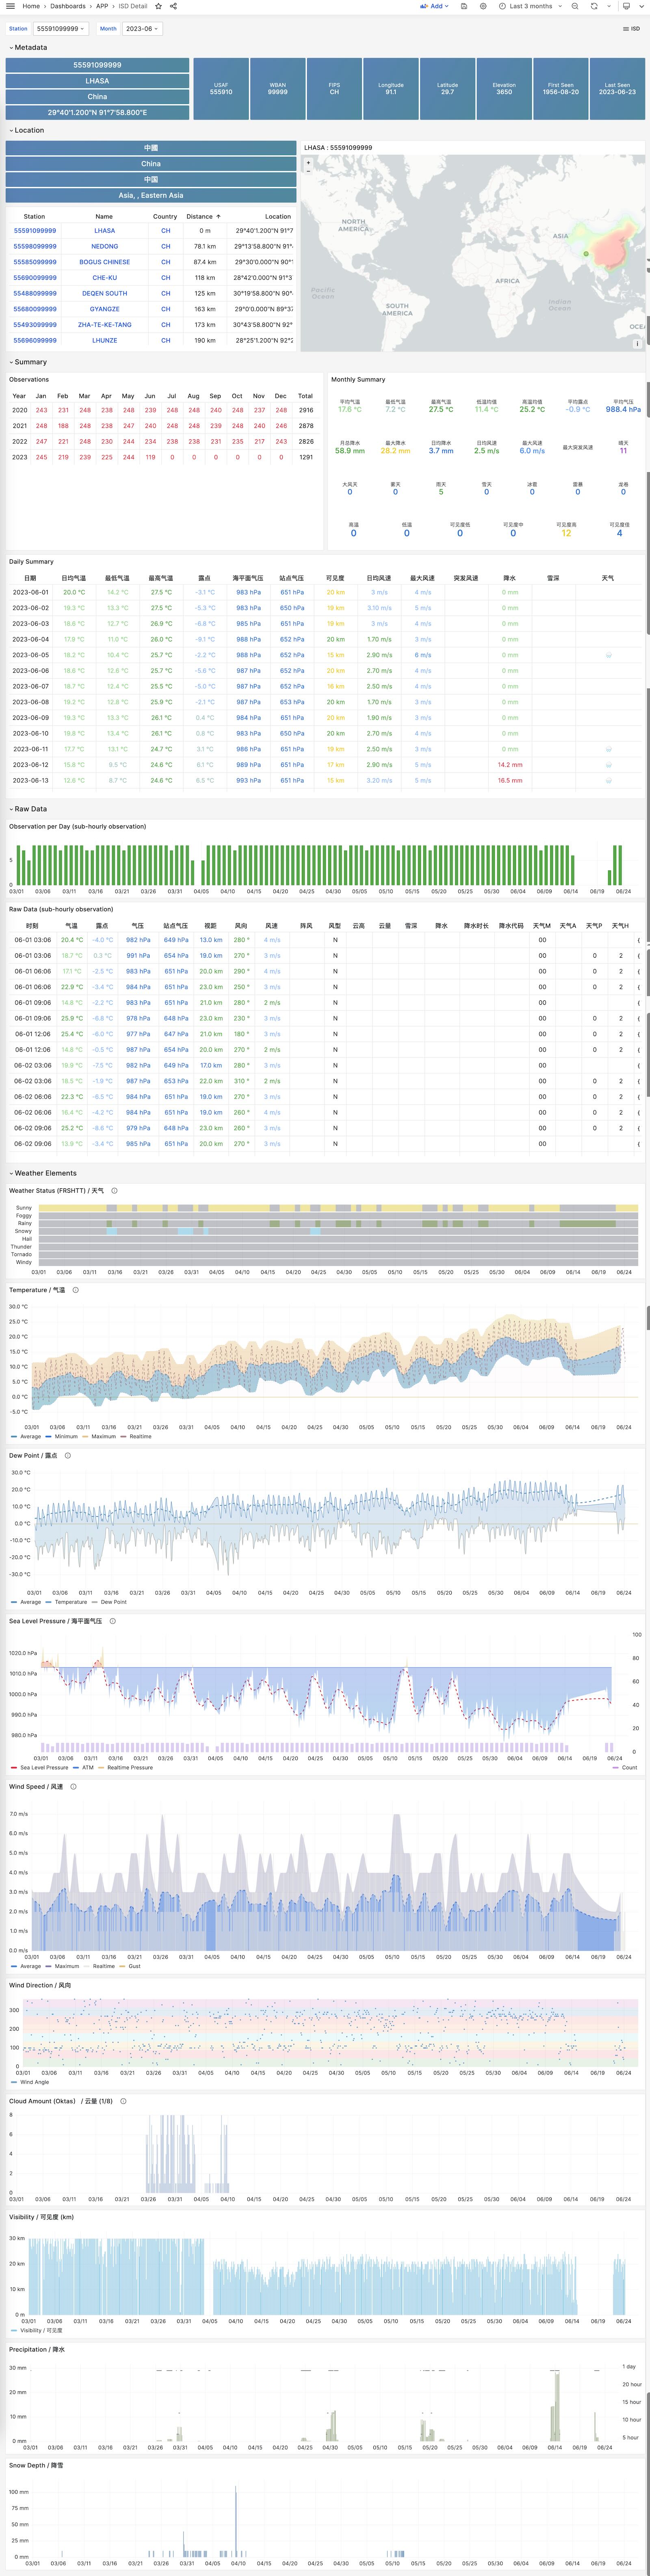
ISD Detail
Visualize hourly observation raw metrics.
ISD Station Dashboard
License
MIT License
3 - WHO COVID-19 Data Analysis
Pigsty built-in application which visualize WHO covid-19 data
The on-line demo:https://demo.pigsty.cc/d/covid-overview


Installation
在管理节点上进入应用目录,执行make以完成安装。
make            # 如果本地数据可用
make all        # 完整安装,从WHO官网下载数据
makd reload     # 重新下载并加载最新数据
其他一些子任务:
make reload     # download latest data and pour it again
make ui         # install grafana dashboards
make sql        # install database schemas
make download   # download latest data
make load       # load downloaded data into database
make reload     # download latest data and pour it into database
Dashboards