监控告警
FerretDB 模块的监控仪表板与告警规则
FERRET 模块目前提供了一个监控仪表板。
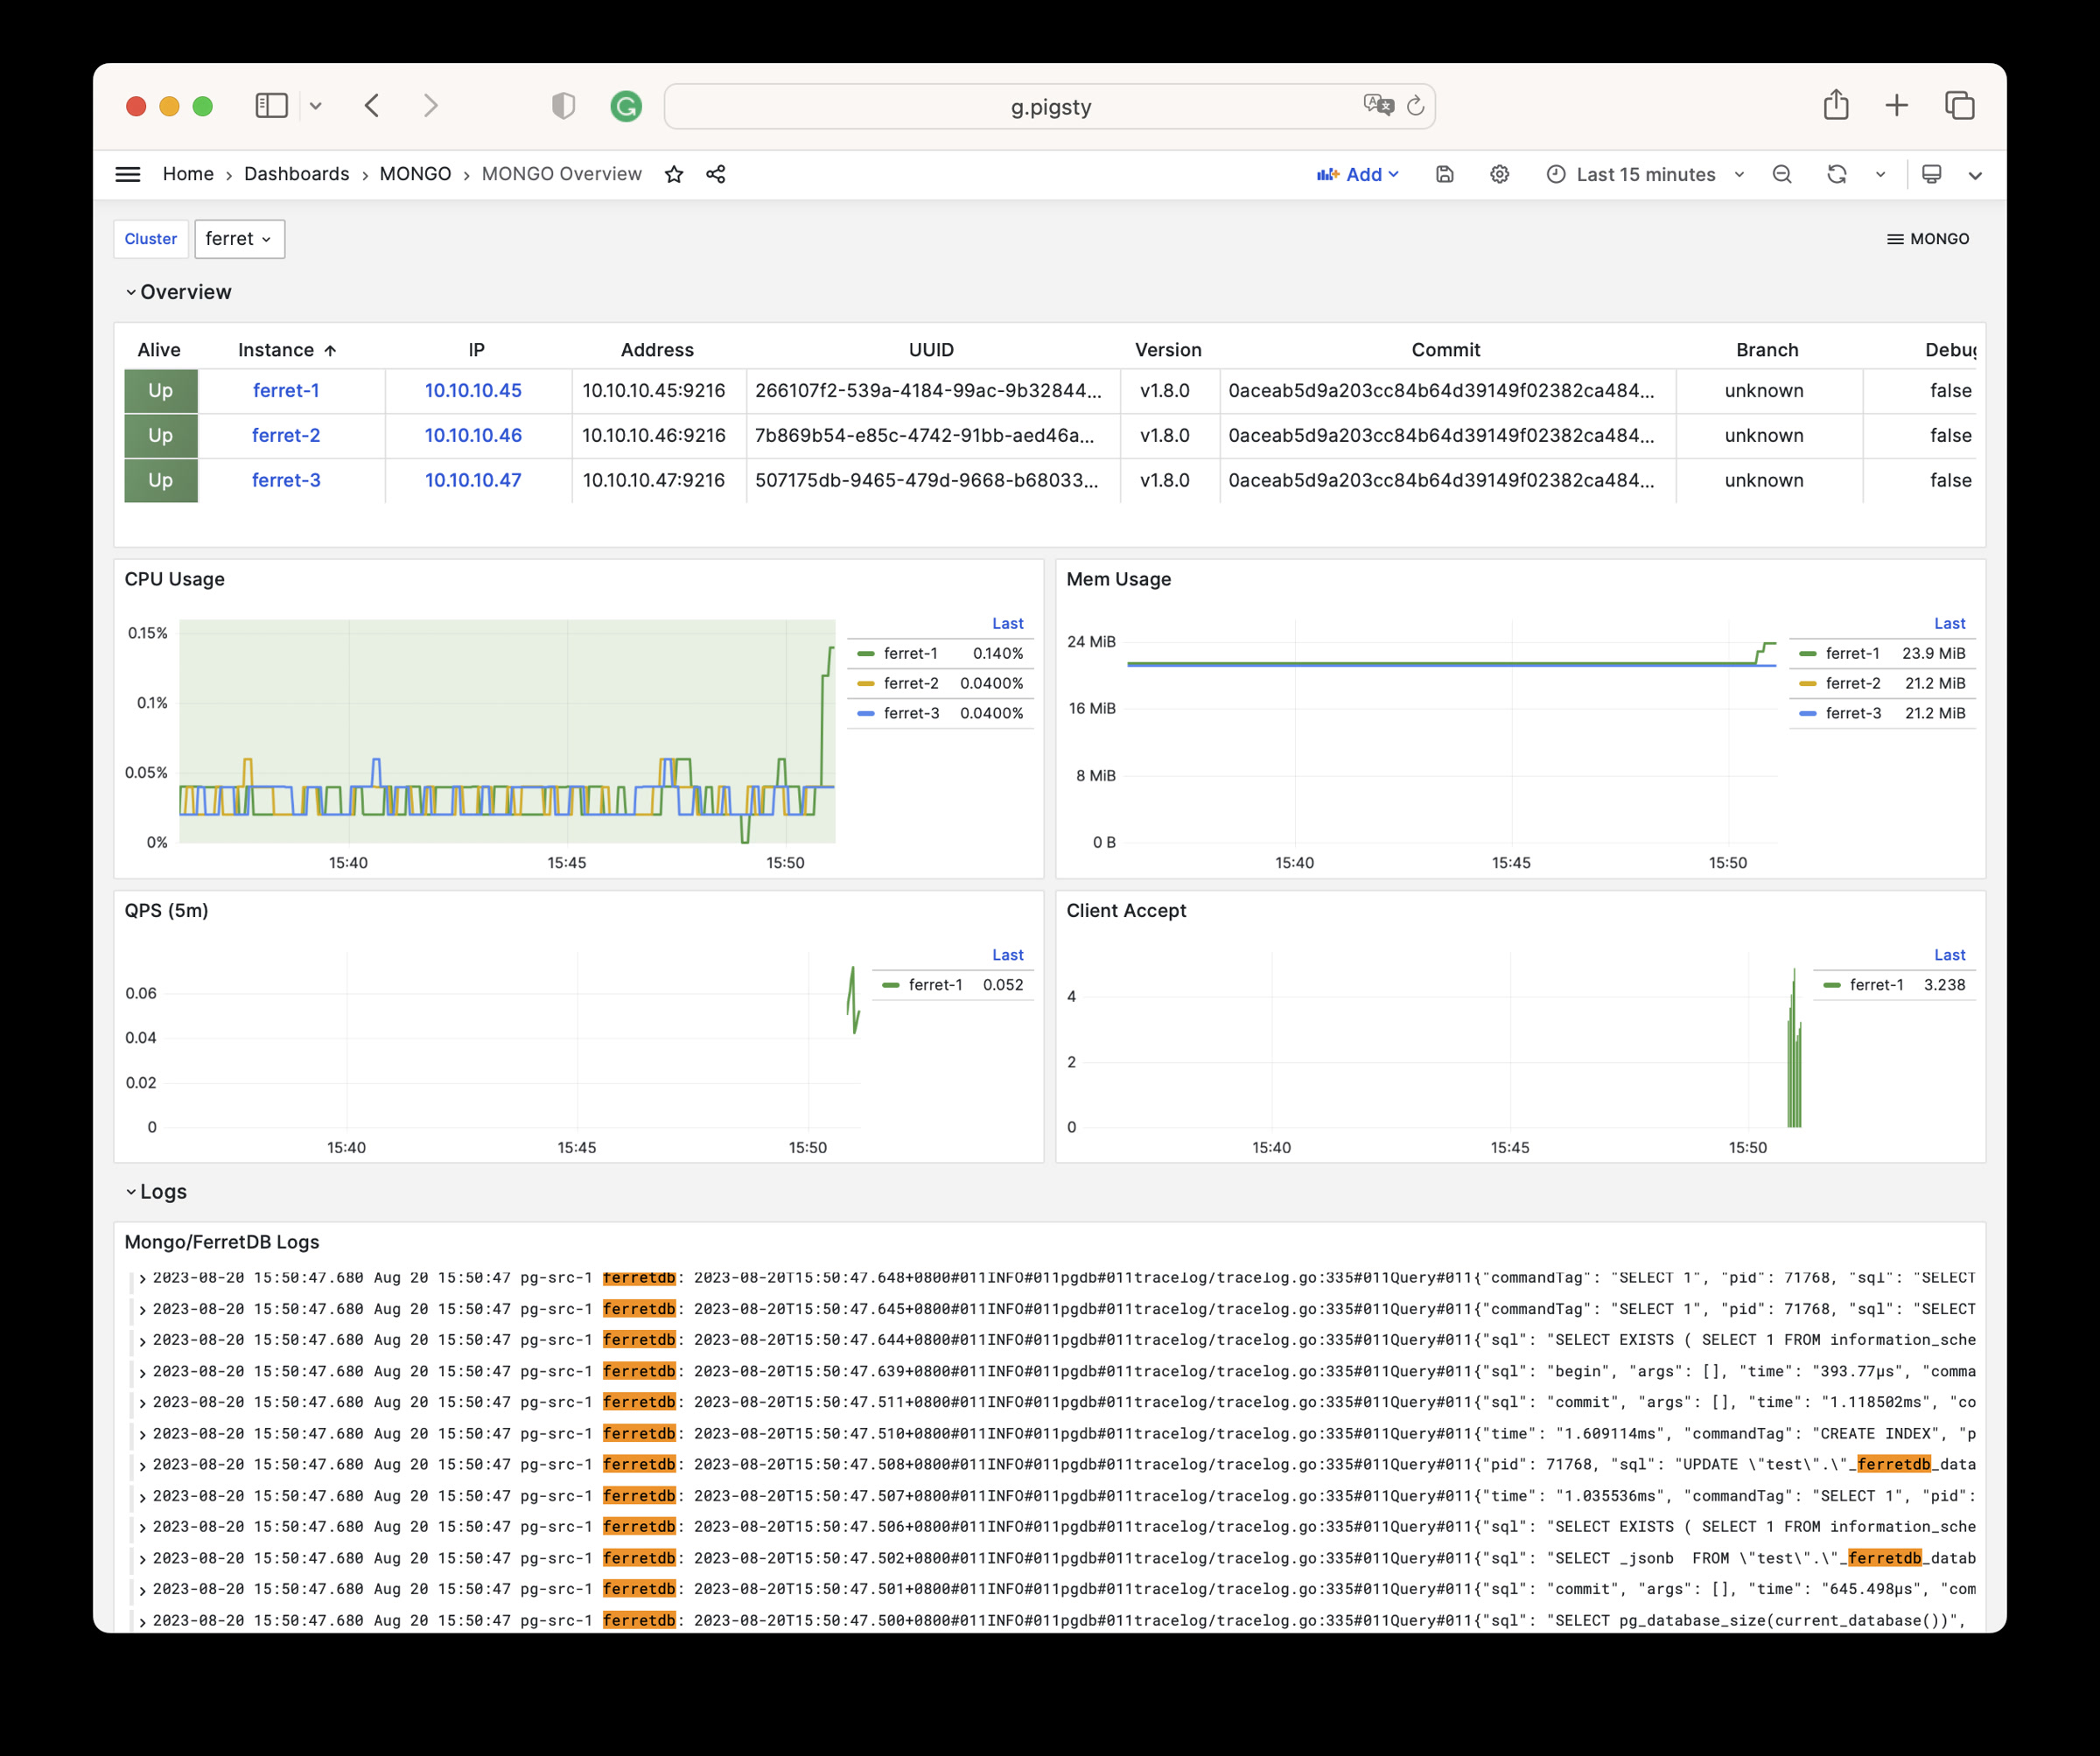
Mongo Overview
Mongo Overview:Mongo/FerretDB 集群概览
这个监控面板提供了关于 FerretDB 的基本监控指标,包括:
- 实例状态:FerretDB 实例的运行状态
- 客户端连接:客户端连接数量和请求统计
- 资源使用:CPU、内存、Goroutine 数量等
- PostgreSQL 连接池:后端 PostgreSQL 连接池状态
由于 FerretDB 底层使用 PostgreSQL 作为存储引擎,更多的监控指标请参考 PostgreSQL 监控。
监控指标
FerretDB 通过内置的 Exporter 在 mongo_exporter_port(默认 9216)端口暴露 Prometheus 格式的监控指标。
关键指标类别包括:
| 指标前缀 | 说明 |
|---|---|
ferretdb_* | FerretDB 核心指标 |
ferretdb_client_* | 客户端连接和请求统计 |
ferretdb_postgresql_* | PostgreSQL 后端状态 |
go_* | Go 运行时指标 |
process_* | 进程级别指标 |
完整的指标列表请参阅 指标列表。
告警规则
Pigsty v4.1 默认规则集中未内置专门的 FerretDB 告警规则(files/victoria/rules/*.yml)。您可以基于 ferretdb_up 指标按需添加自定义告警,例如:
- alert: FerretDBDown
  expr: ferretdb_up == 0
  for: 1m
  labels:
    severity: critical
  annotations:
    summary: "FerretDB instance {{ $labels.ins }} is down"
    description: "FerretDB instance {{ $labels.ins }} on {{ $labels.ip }} has been down for more than 1 minute."
由于 FerretDB 是无状态的代理层,主要的监控和告警应集中在底层 PostgreSQL 集群。