INFRA 架构
运行生产级别高可用 PostgreSQL 集群,通常需要一套完善的基础设施服务(底座)来支撑,例如监控告警、日志收集、时间同步、DNS 解析,本地软件仓库等。 Pigsty 提供了 INFRA 模块 来解决这个问题 —— 这是一个 可选模块,但我们强烈推荐启用它。
概览
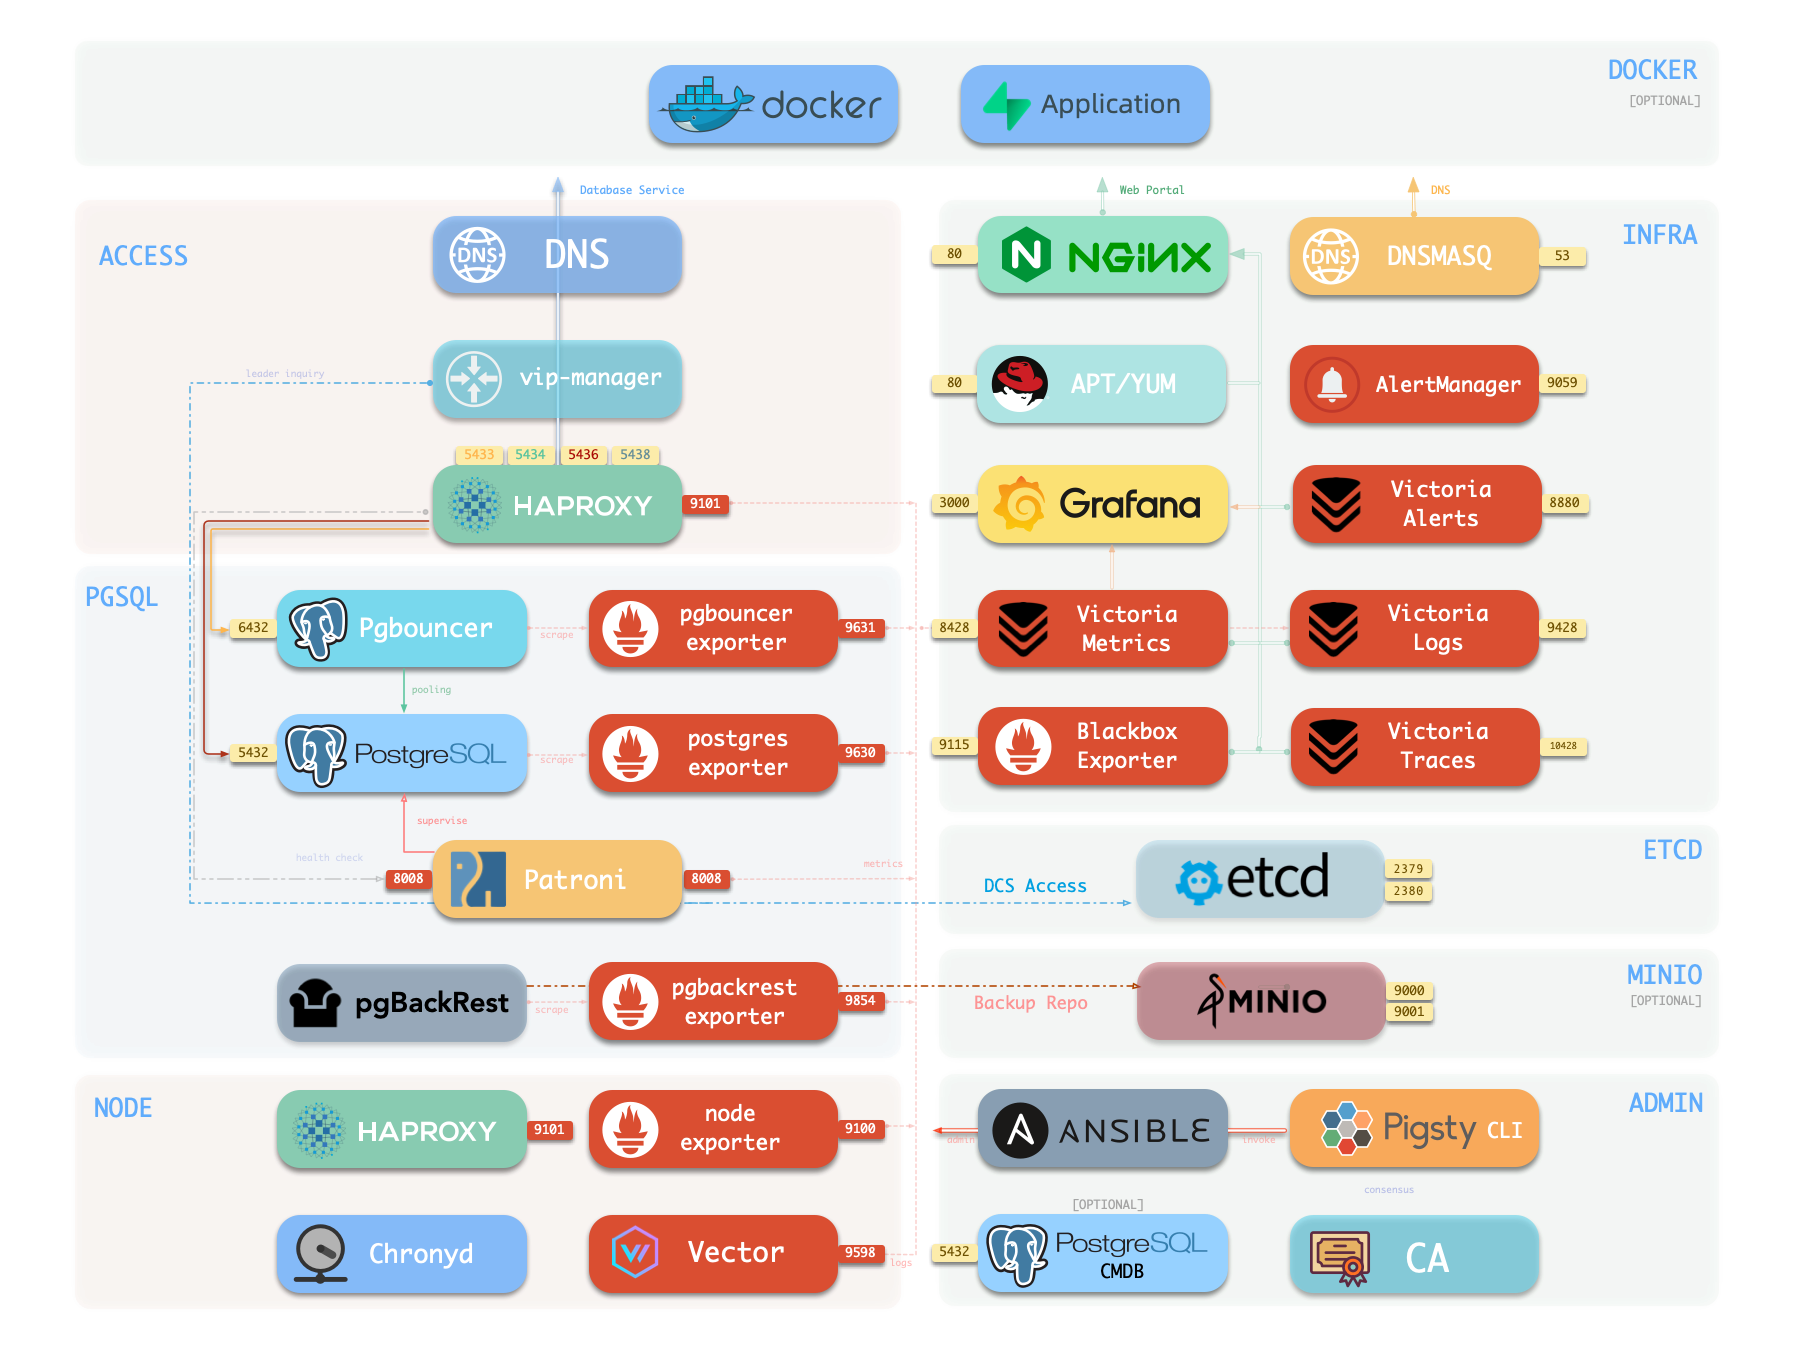
下图是 单机部署 时的架构示意图,图中右半部分即为 INFRA 模块 所包含的组件,其中包括:
| 组件 | 种类 | 描述 |
|---|---|---|
| Nginx | Web服务器 | Web 界面 的统一入口,本地软件仓库,内部服务的反向代理 |
| Repo | 软件仓库 | APT / DNF 仓库,下载有所有部署需要的 RPM/DEB 包及其依赖 |
| Grafana | 可视化平台 | 呈现监控指标、日志与链路追踪,承载监控大屏、巡检报表以及自定义数据应用。 |
| VictoriaMetrics | 时序数据库 | 拉取全部监控指标,兼容 Prometheus API,并通过 VMUI 提供查询界面。 |
| VictoriaLogs | 日志平台 | 集中收集存储日志,所有节点默认运行 Vector,将系统日志与数据库日志推送到此。 |
| VictoriaTraces | 链路追踪 | 收集慢 SQL、服务链路等追踪数据。 |
| VMAlert | 告警计算 | 评估告警规则,将事件推送至 Alertmanager。 |
| AlertManager | 告警管理 | 聚合告警事件,分发告警通知,支持邮件、Webhook 等渠道。 |
| BlackboxExporter | 黑盒探测 | 探测各个 IP/VIP/URL 的可达性。 |
| DNSMASQ | DNS解析 | 提供 DNS 解析服务,解析 Pigsty 内部使用到的域名。【可选】 |
| Chronyd | 时间同步 | 提供 NTP 时间同步服务,确保所有节点时间一致。 【可选】 |
| CA | 证书签发 | 签发环境内的加密证书 |
| Ansible | 发起管理 | 批量,声明式,无 Agent 管理大量服务器的工具 |
Nginx
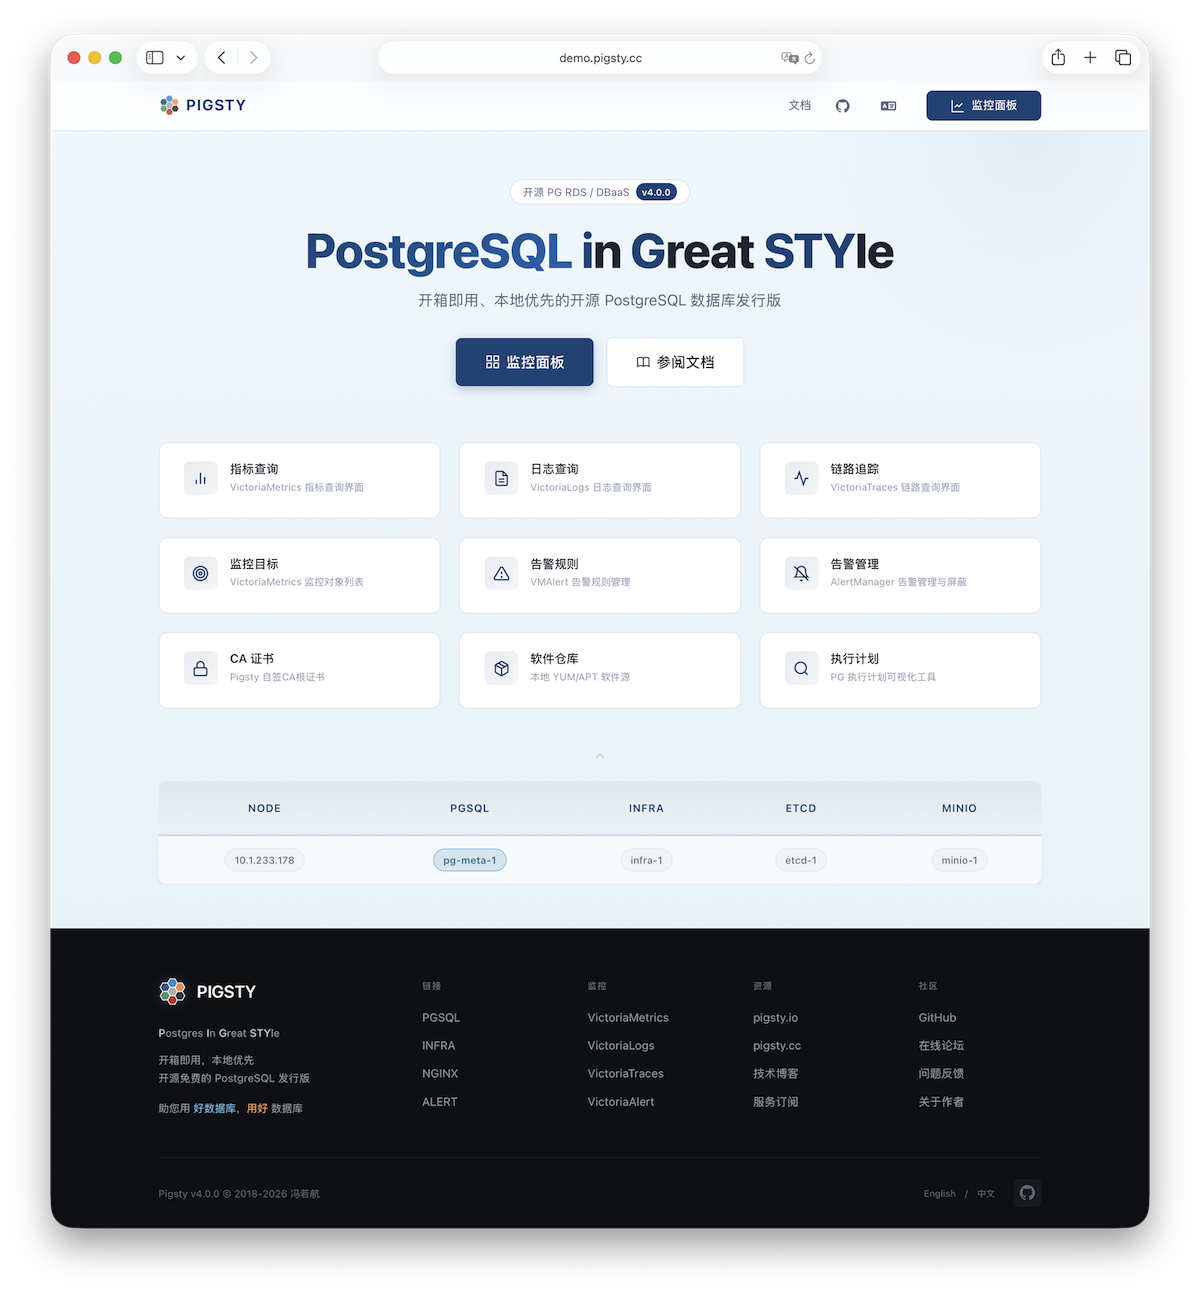
Nginx 是 Pigsty 所有 WebUI 类服务的访问入口,默认使用 80 / 443 端口对外提供 HTTP / HTTPS 服务。在线演示
| IP访问(替换) | 域名(HTTP) | 域名(HTTPS) | 公开演示 | |
|---|---|---|---|---|
http://10.10.10.10 | http://i.pigsty | https://i.pigsty | https://demo.pigsty.cc |
带有 WebUI 的基础设施组件可以通过 Nginx 统一对外暴露服务,例如 Grafana、VictoriaMetrics(VMUI)、AlertManager, 以及 HAProxy 控制台,此外,本地软件仓库 等静态文件资源也通过 Nginx 对内外提供服务。
Nginx 会根据 infra_portal 中的定义,配置本地 Web 服务器或反向代理服务器。
infra_portal:
  home : { domain: i.pigsty }
默认情况下将对外暴露 Pigsty 的管理首页:i.pigsty,上面不同的端点挂载代理了不同的组件:
| 端点 | 组件 | 原生端口 | 备注 | 公开演示 |
|---|---|---|---|---|
/ | Nginx | 80/443 | 首页、本地仓库、文件服务 | demo.pigsty.cc/zh/ |
/ui/ | Grafana | 3000 | Grafana 仪表盘入口 | demo.pigsty.cc/ui/ |
/vmetrics/ | VictoriaMetrics | 8428 | 时序数据库 Web UI | demo.pigsty.cc/vmetrics/ |
/vlogs/ | VictoriaLogs | 9428 | 日志数据库 Web UI | demo.pigsty.cc/vlogs/ |
/vtraces/ | VictoriaTraces | 10428 | 链路追踪 Web UI | demo.pigsty.cc/vtraces/ |
/vmalert/ | VMAlert | 8880 | 告警规则管理 | demo.pigsty.cc/vmalert/ |
/alertmgr/ | AlertManager | 9059 | 告警管理 Web UI | demo.pigsty.cc/alertmgr/ |
/blackbox/ | Blackbox | 9115 | 黑盒探测器 |
Pigsty 允许对 Nginx 进行丰富的定制,将其作为本地文件服务器,或者反向代理服务器,配置自签名或者真正的 HTTPS 证书。
更多信息,请参阅:教程:Nginx:向外代理暴露Web服务 与 教程:Certbot:申请与更新HTTPS证书
Repo
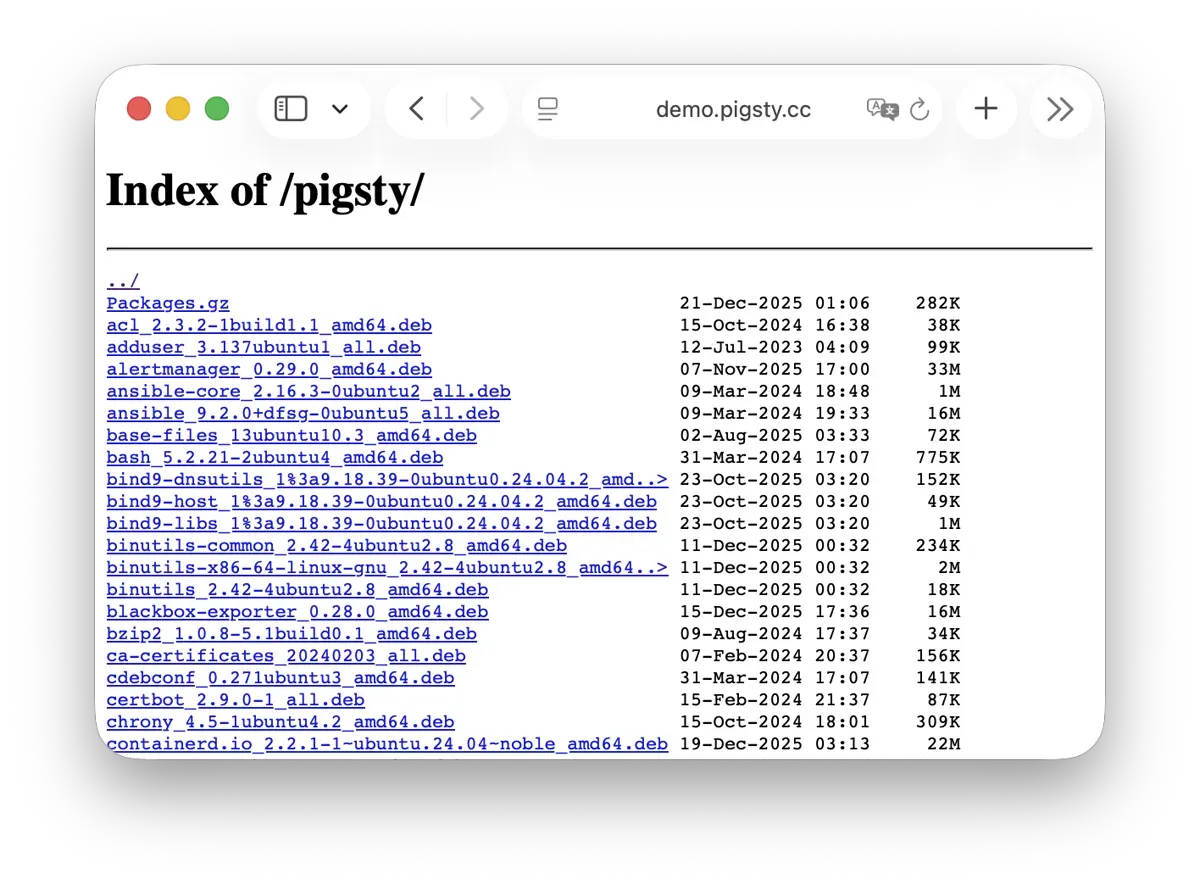
Pigsty 会在安装时,默认在 Infra 节点上创建一个 本地软件仓库,以加速后续软件安装。在线演示
该软件仓库默认位于 /www/pigsty 目录,
由 Nginx 对外提供服务,挂载在 /pigsty 路径上:
| IP访问(替换) | 域名(HTTP) | 域名(HTTPS) | 公开演示 | |
|---|---|---|---|---|
http://10.10.10.10/pigsty | http://i.pigsty/pigsty | https://i.pigsty/pigsty | https://demo.pigsty.cc/pigsty |
Pigsty 支持 离线安装,实质上是将做好的本地软件仓库提前复制到目标环境中。
当 Pigsty 执行生产部署,需要创建本地软件仓库时,如果发现本地已经存在 /www/pigsty/repo_complete 标记文件,则会跳过从上游下载软件包的步骤,直接使用已有的软件包,避免联网下载。
更多信息,请参阅:配置:INFRA - REPO
Grafana
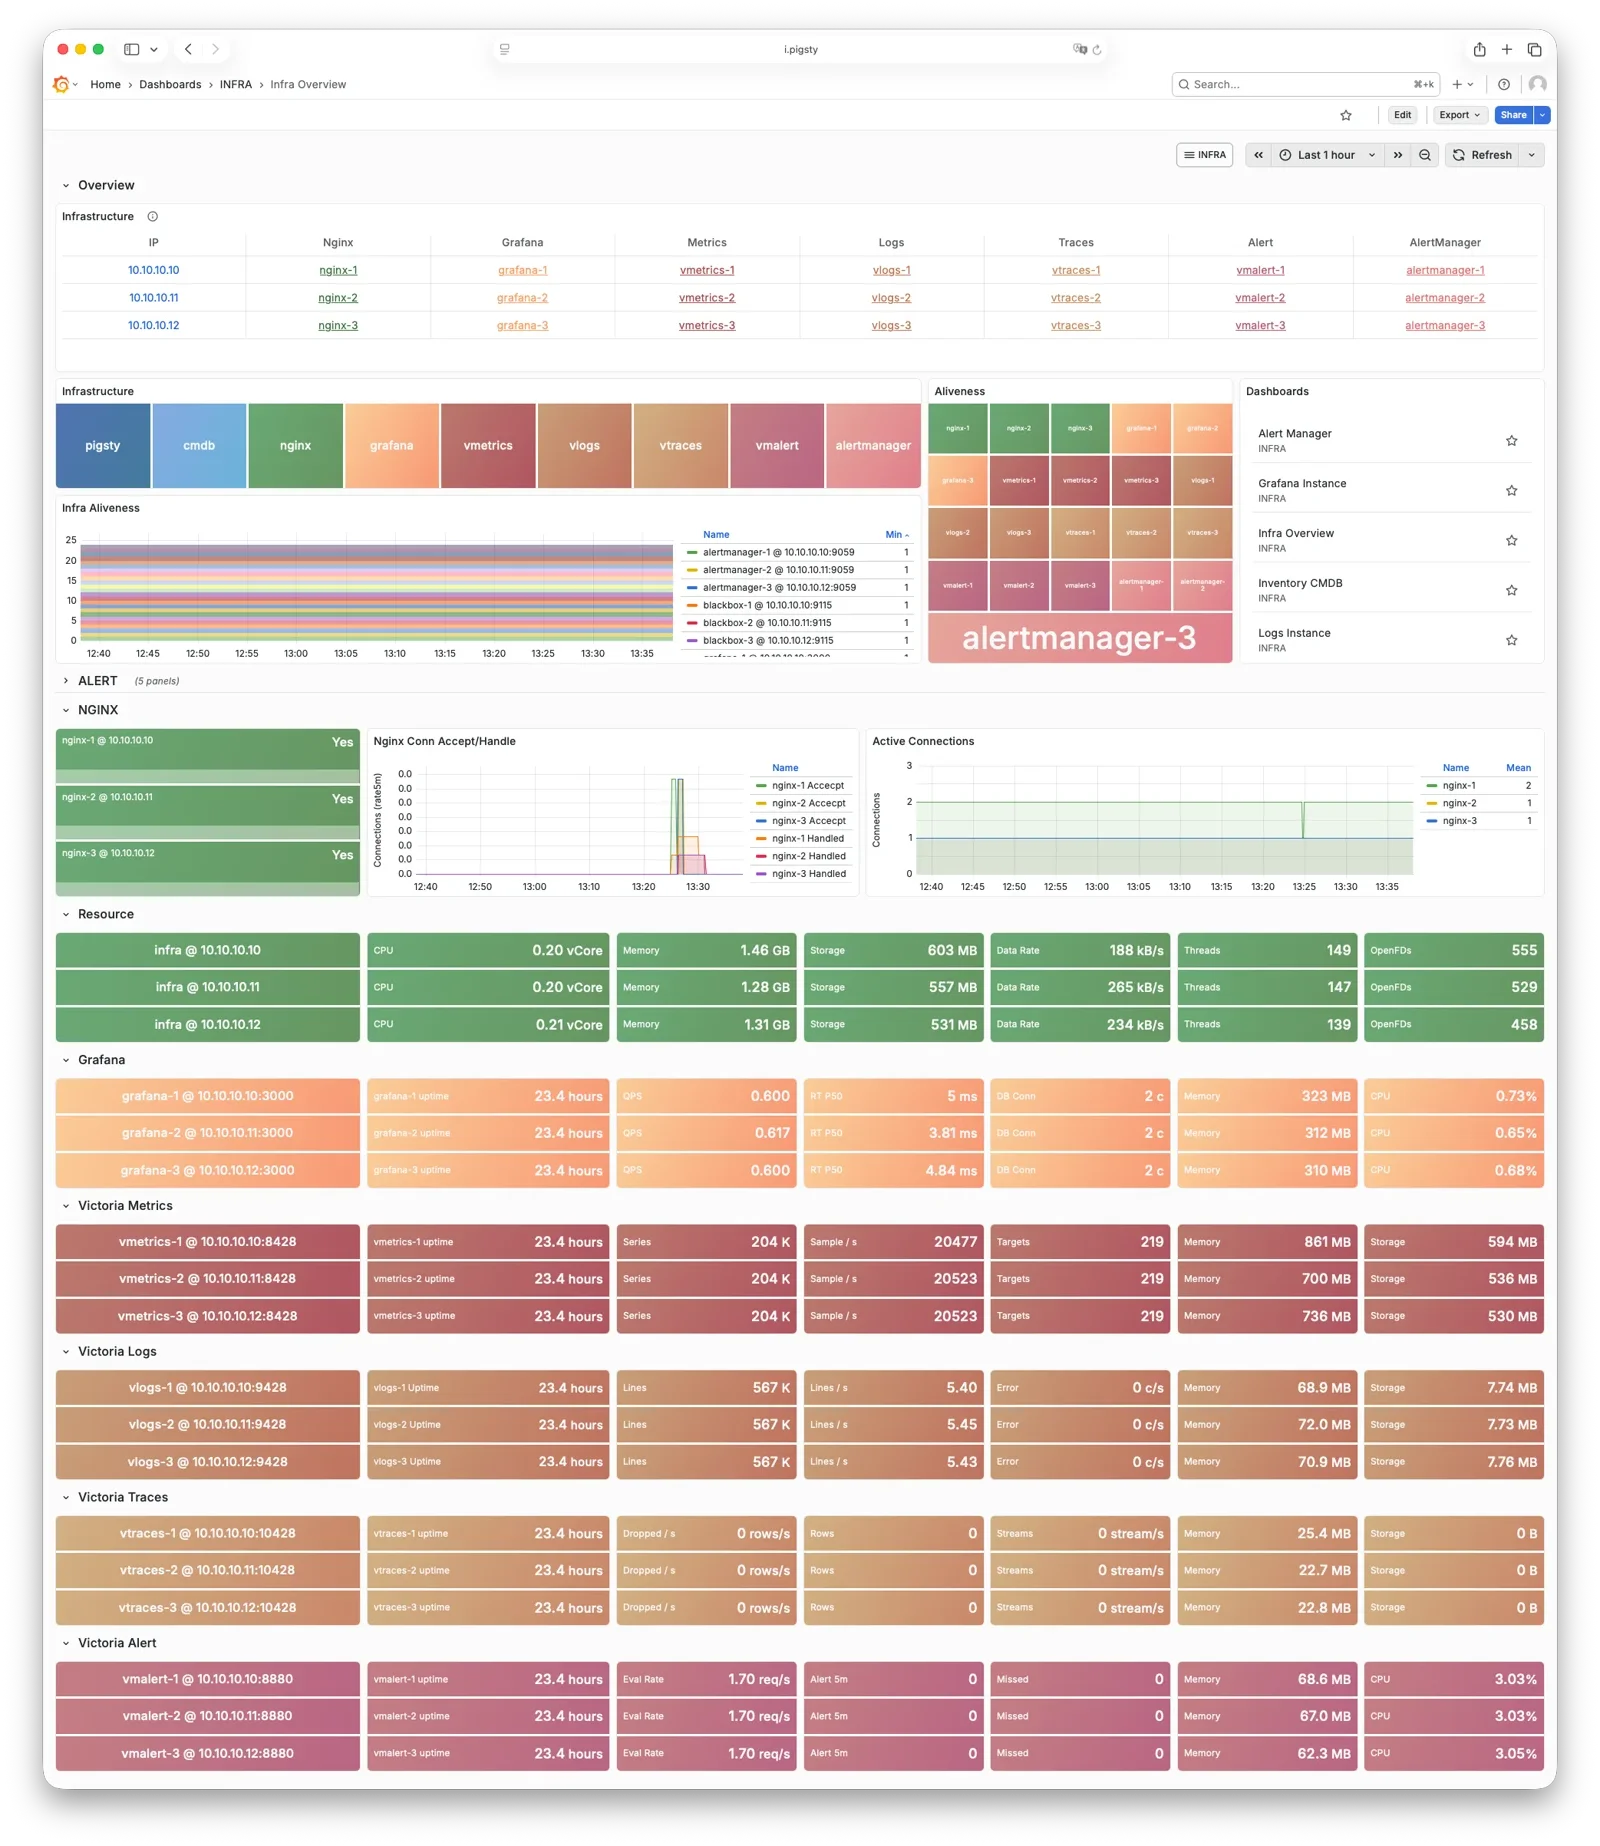
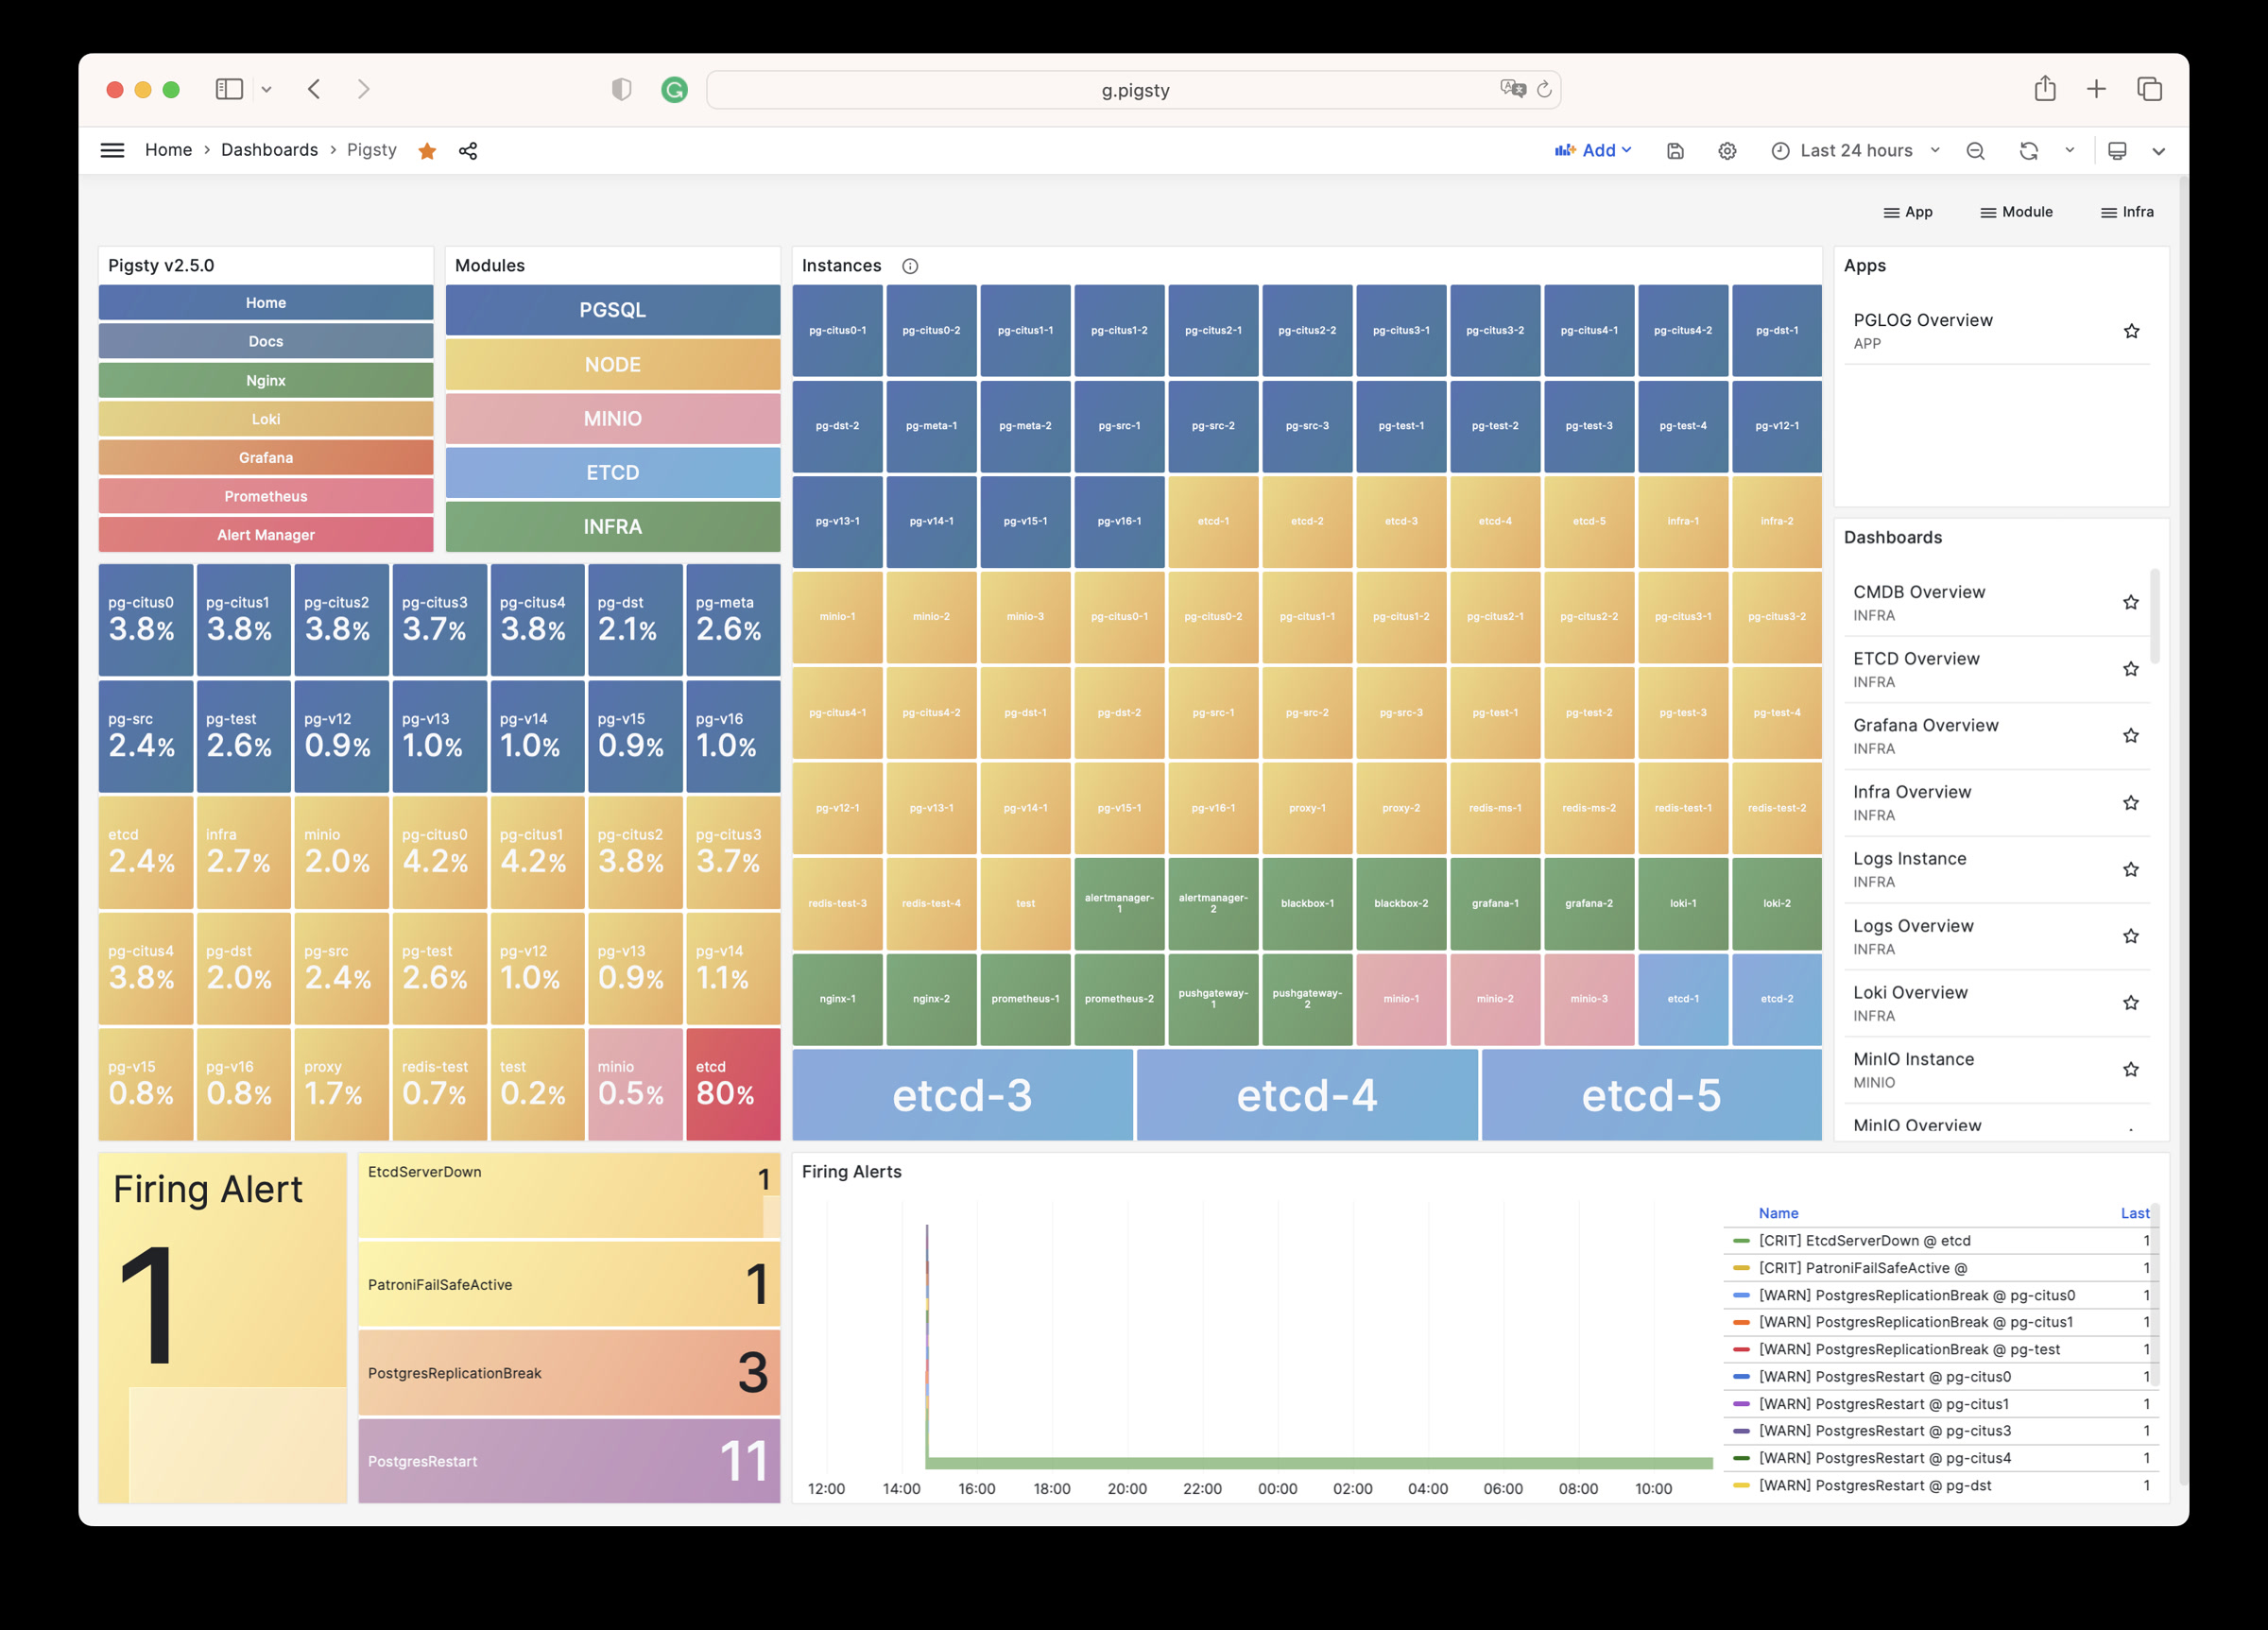
Grafana 是 Pigsty 监控系统的核心组件,用于可视化展示监控指标、日志与各种信息。在线演示
Grafana 默认监听 3000 端口,挂载于 Nginx /ui 路径点上代理访问:
| IP访问(替换) | 域名(HTTP) | 域名(HTTPS) | 公开演示 | |
|---|---|---|---|---|
http://10.10.10.10/ui | http://i.pigsty/ui | https://i.pigsty/ui | https://demo.pigsty.cc/ui |
Pigsty 预置了基于 VictoriaMetrics / Logs / Traces 的大量监控面板,并通过 URL 跳转实现一键下钻上卷,帮助快速定位故障。
Grafana 亦可作为低代码可视化平台使用,因此默认安装 ECharts、victoriametrics-datasource、victorialogs-datasource 等插件,
同时将 Vector / Victoria 数据源统一注册为 vmetrics-*、vlogs-*、vtraces-*,方便扩展自定义仪表板。
更多信息请参阅:配置:INFRA - GRAFANA。
VictoriaMetrics
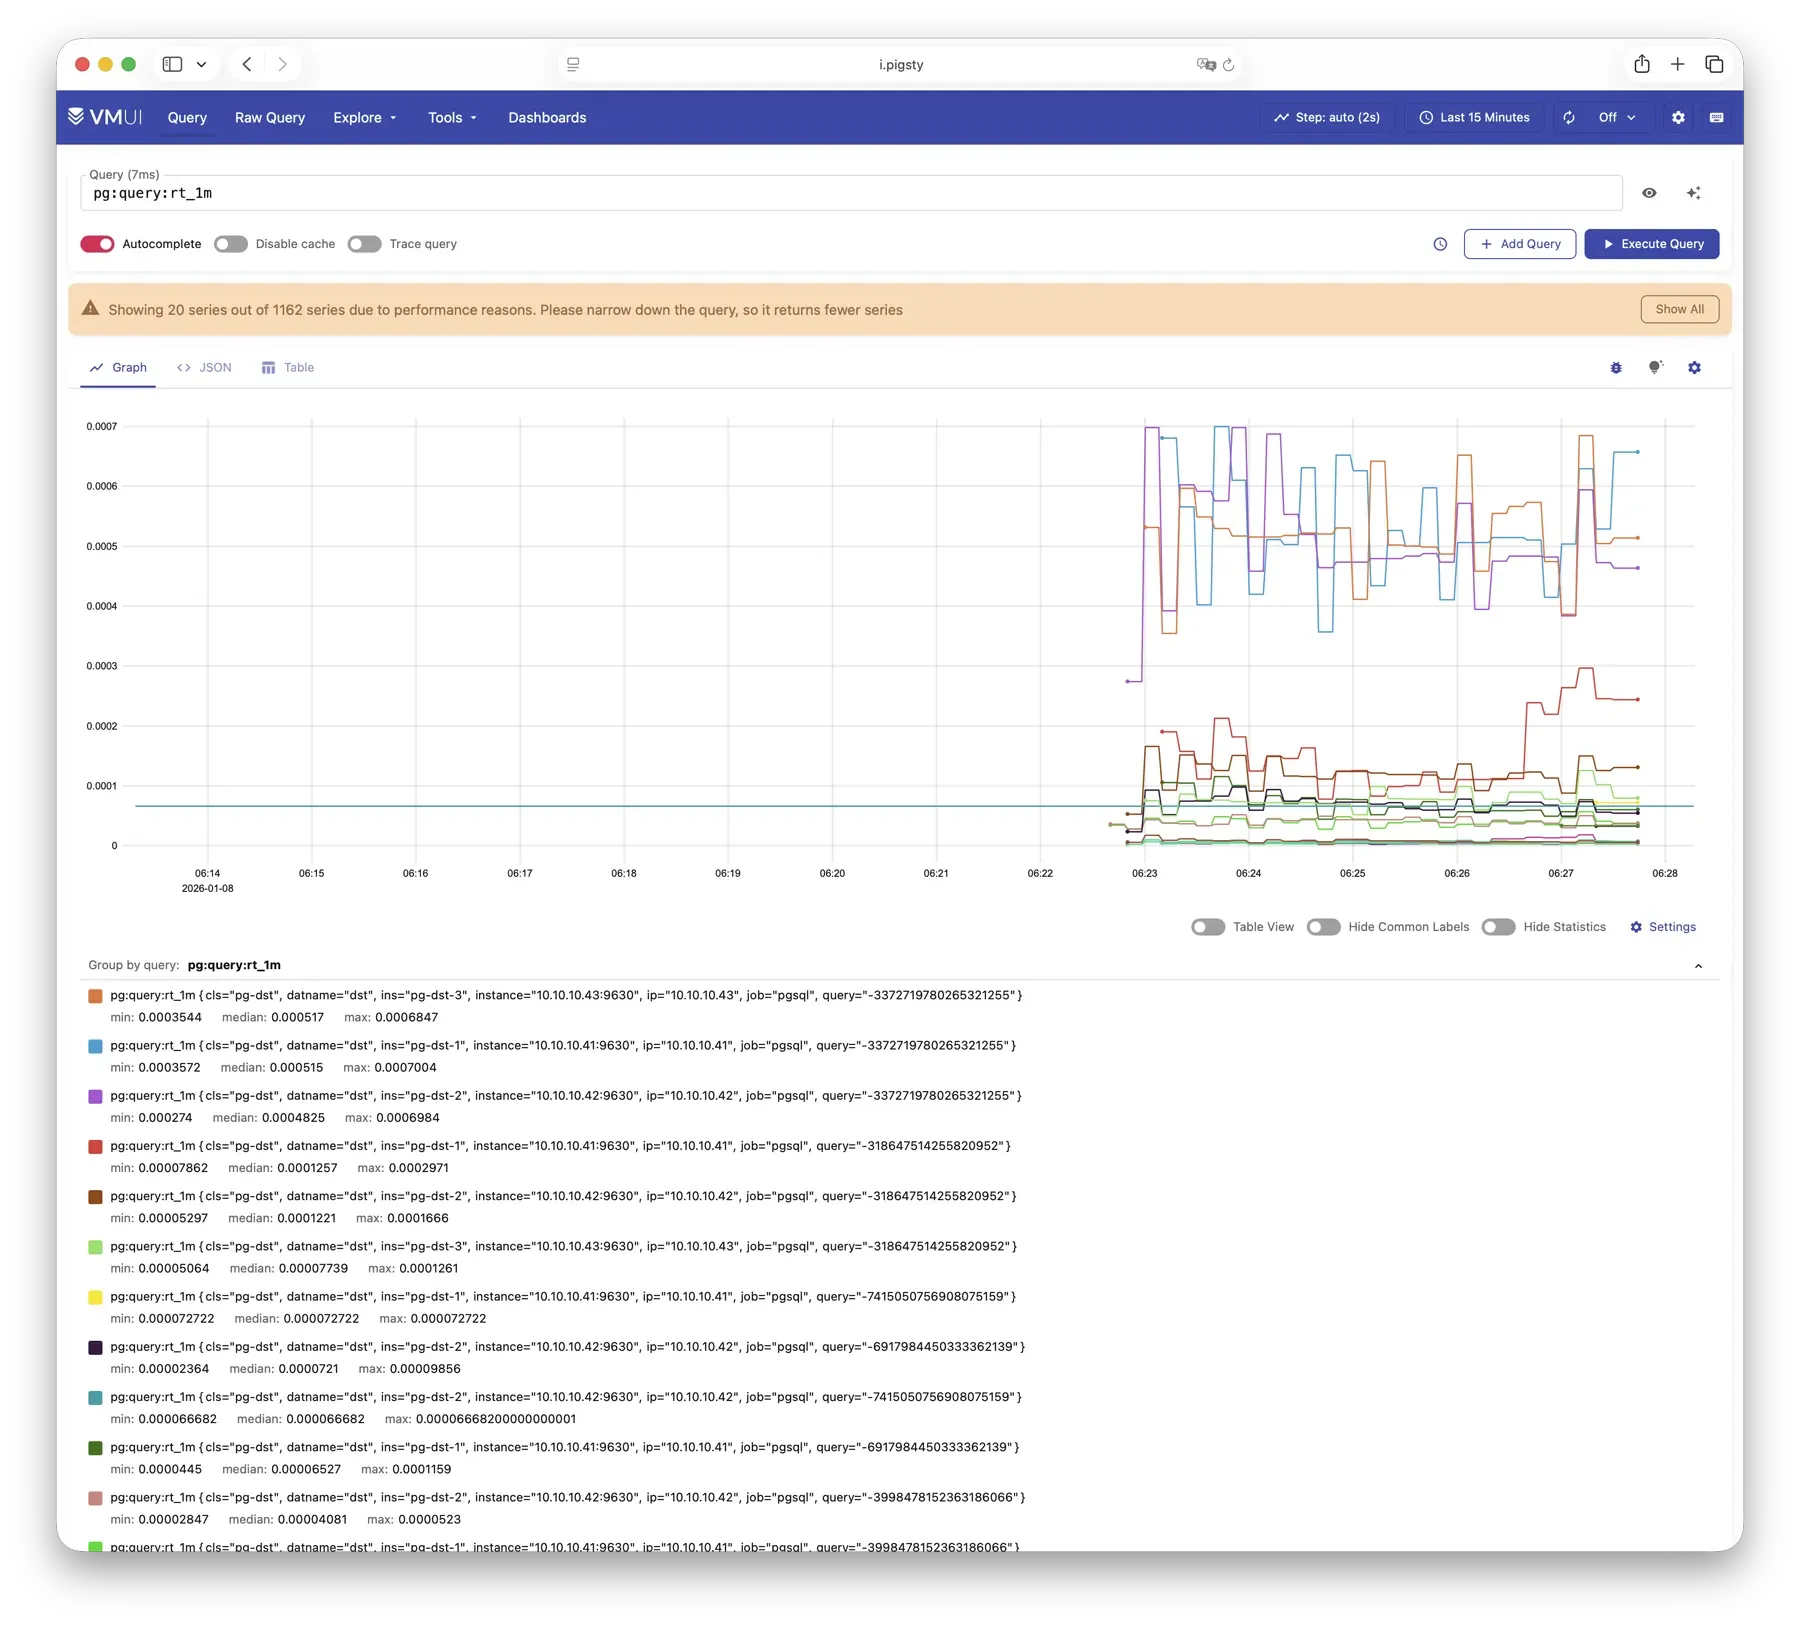
VictoriaMetrics 是 Pigsty 的时序数据库,负责拉取并存储所有监控指标。在线演示
默认监听 8428 端口,挂载于 Nginx /vmetrics 路径上,亦可通过 p.pigsty 域名直接访问:
| IP访问(替换) | 域名(HTTP) | 域名(HTTPS) | 公开演示 | |
|---|---|---|---|---|
http://10.10.10.10/vmetrics | http://p.pigsty | https://i.pigsty/vmetrics | https://demo.pigsty.cc/vmetrics |
VictoriaMetrics 完全兼容 Prometheus API,支持 PromQL 查询、远程读写协议以及 Alertmanager API。 内置的 VMUI 提供即席查询界面,可直接探索指标数据,也可作为 Grafana 的数据源使用。
更多信息请参阅:配置:INFRA - VMETRICS
VictoriaLogs
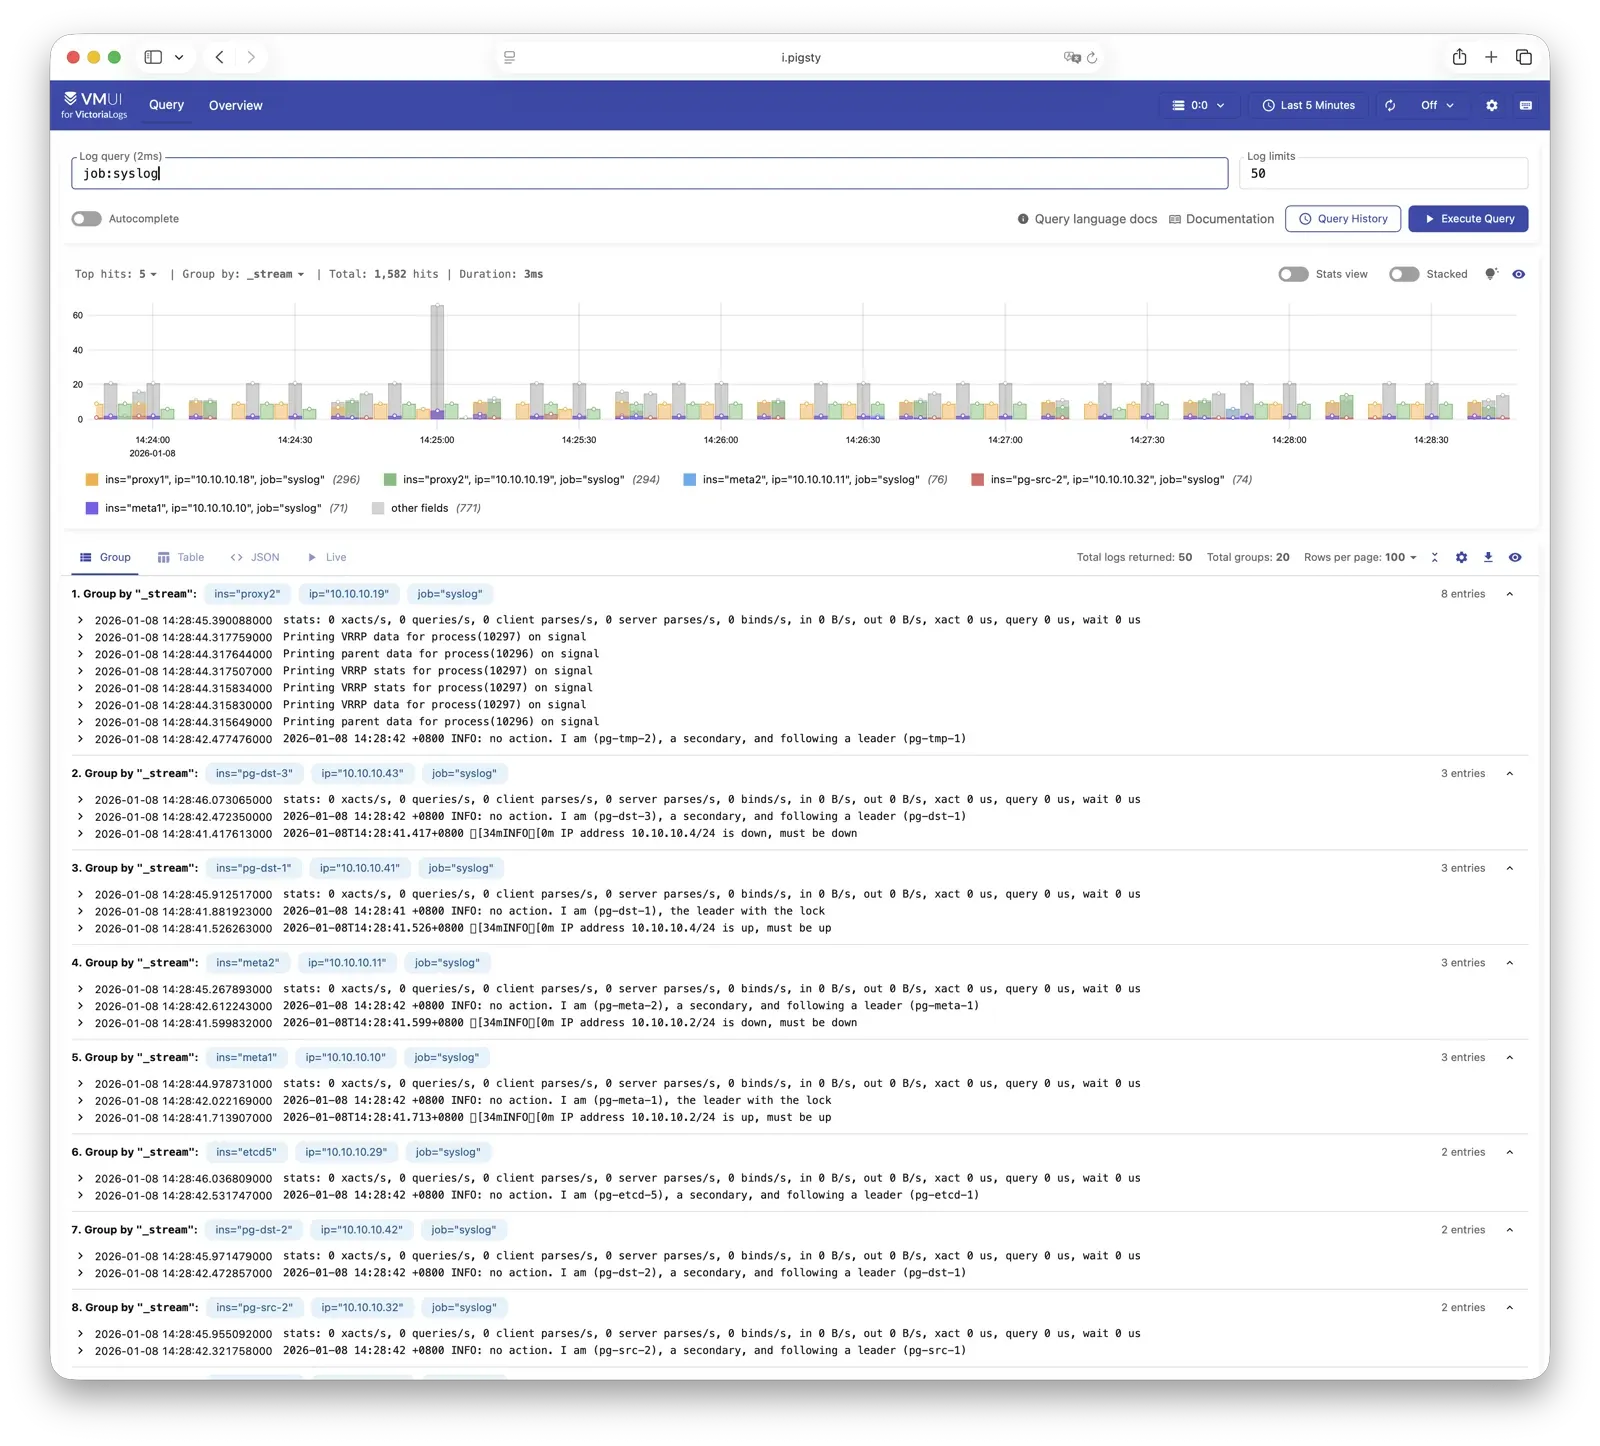
VictoriaLogs 是 Pigsty 的日志平台,集中存储来自所有节点的结构化日志。在线演示
默认监听 9428 端口,挂载于 Nginx /vlogs 路径上:
| IP访问(替换) | 域名(HTTP) | 域名(HTTPS) | 公开演示 | |
|---|---|---|---|---|
http://10.10.10.10/vlogs | http://i.pigsty/vlogs | https://i.pigsty/vlogs | https://demo.pigsty.cc/vlogs |
所有纳管节点默认运行 Vector Agent,负责收集系统日志、PostgreSQL 日志、Patroni 日志、Pgbouncer 日志等,结构化处理后推送至 VictoriaLogs。 内置 Web UI 支持日志检索与过滤,也可配合 Grafana 的 victorialogs-datasource 插件进行可视化分析。
更多信息请参阅:配置:INFRA - VLOGS
VictoriaTraces
VictoriaTraces 用于收集链路追踪数据与慢 SQL 记录。在线演示
默认监听 10428 端口,挂载于 Nginx /vtraces 路径上:
| IP访问(替换) | 域名(HTTP) | 域名(HTTPS) | 公开演示 | |
|---|---|---|---|---|
http://10.10.10.10/vtraces | http://i.pigsty/vtraces | https://i.pigsty/vtraces | https://demo.pigsty.cc/vtraces |
VictoriaTraces 提供 Jaeger 兼容接口,可用于分析服务调用链路与数据库慢查询。 结合 Grafana 面板,能够快速定位性能瓶颈,追溯问题根因。
更多信息请参阅:配置:INFRA - VTRACES
VMAlert
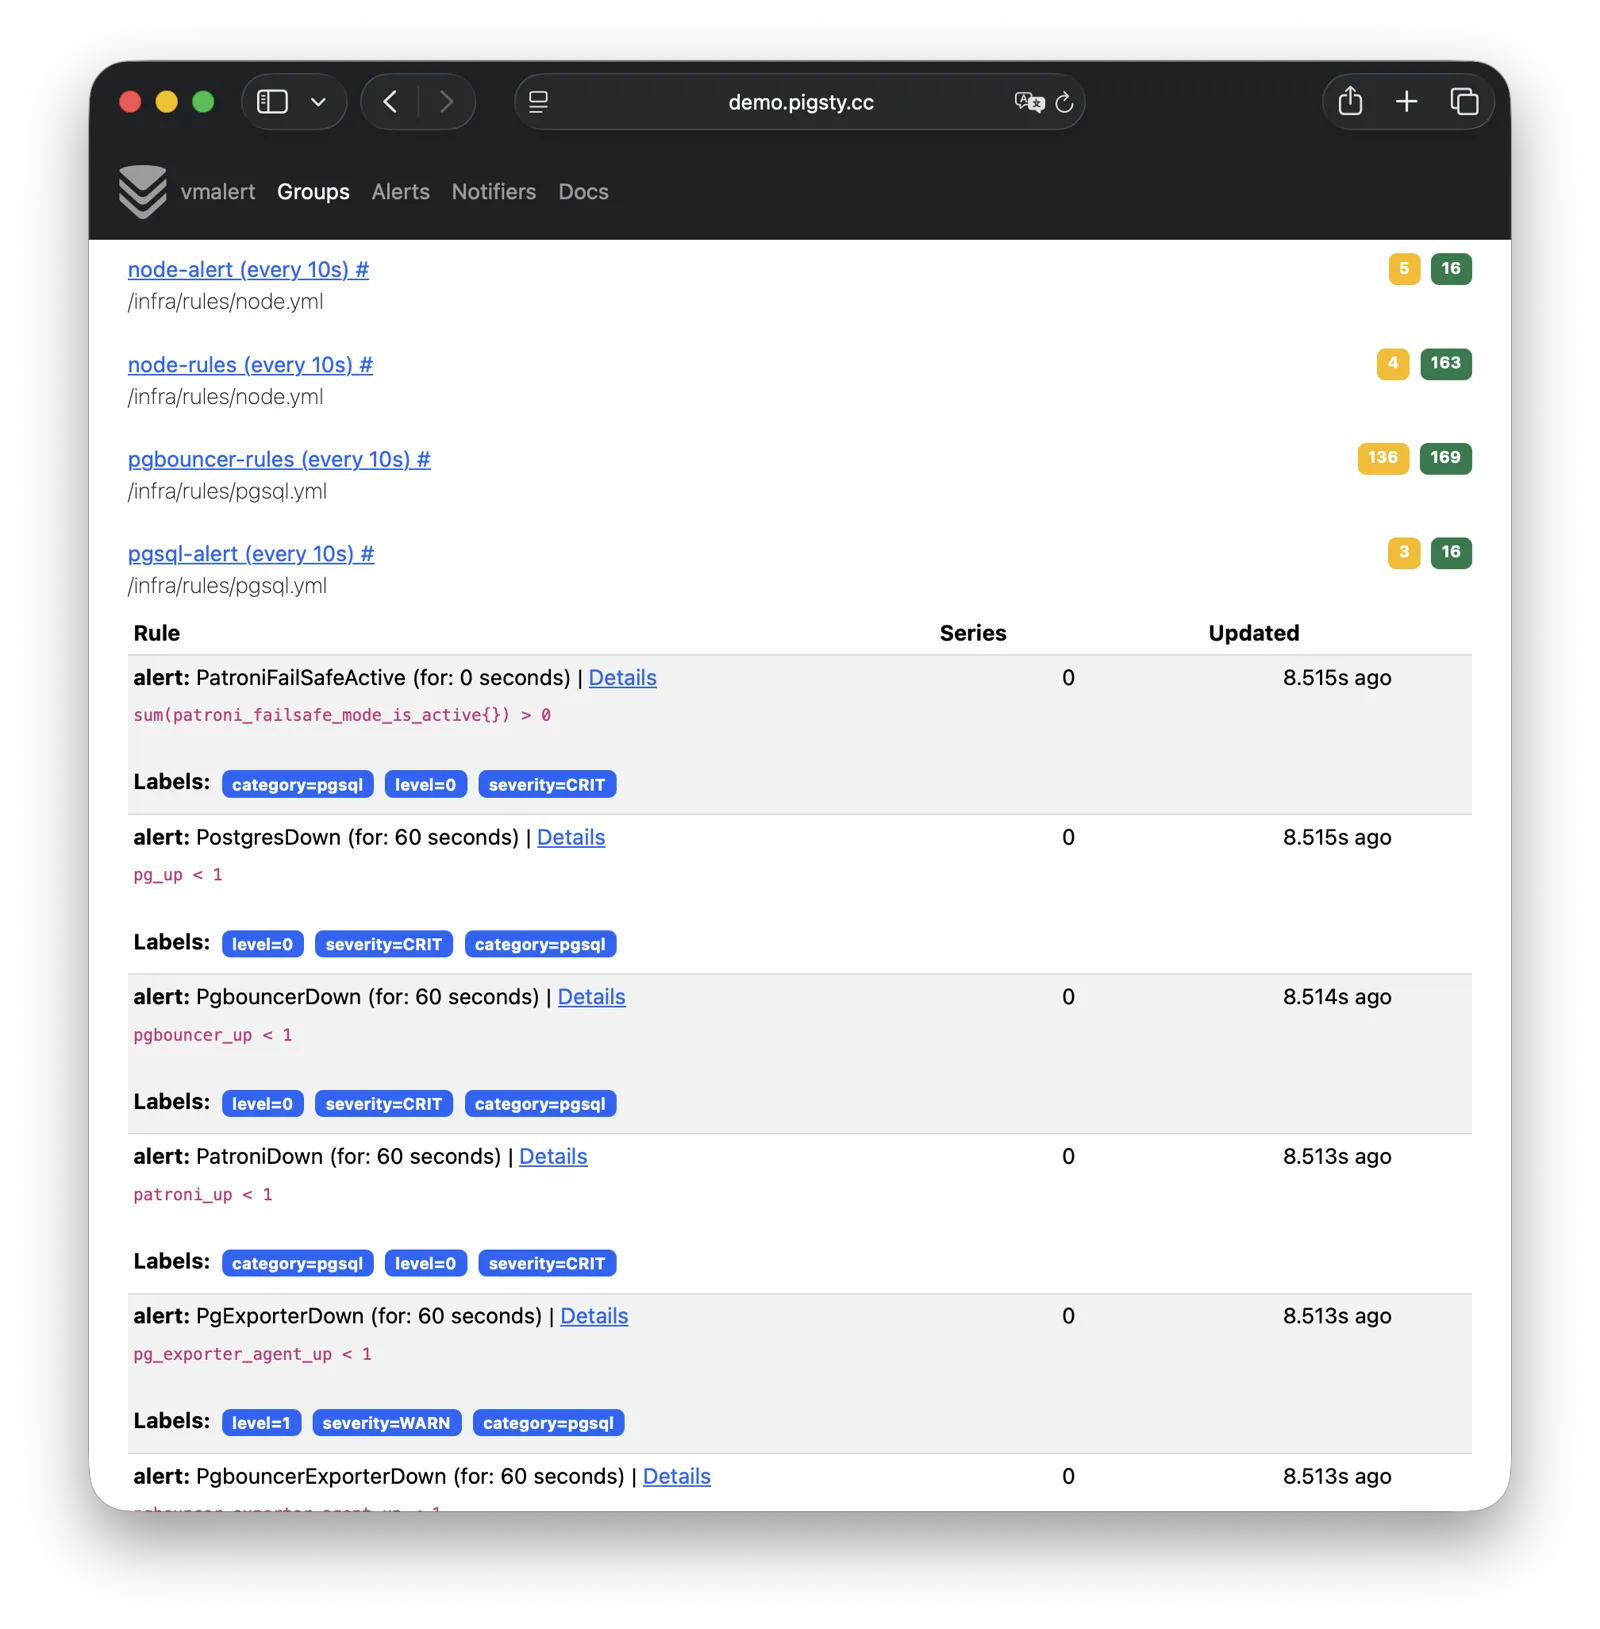
VMAlert 是告警规则计算引擎,负责评估告警规则并将触发的事件推送至 Alertmanager。在线演示
默认监听 8880 端口,挂载于 Nginx /vmalert 路径上:
| IP访问(替换) | 域名(HTTP) | 域名(HTTPS) | 公开演示 | |
|---|---|---|---|---|
http://10.10.10.10/vmalert | http://i.pigsty/vmalert | https://i.pigsty/vmalert | https://demo.pigsty.cc/vmalert |
VMAlert 从 VictoriaMetrics 读取指标数据,周期性执行告警规则评估。 Pigsty 预置了 PGSQL、NODE、REDIS 等模块的告警规则,覆盖常见故障场景,开箱即用。
更多信息请参阅:配置:INFRA - VMALERT
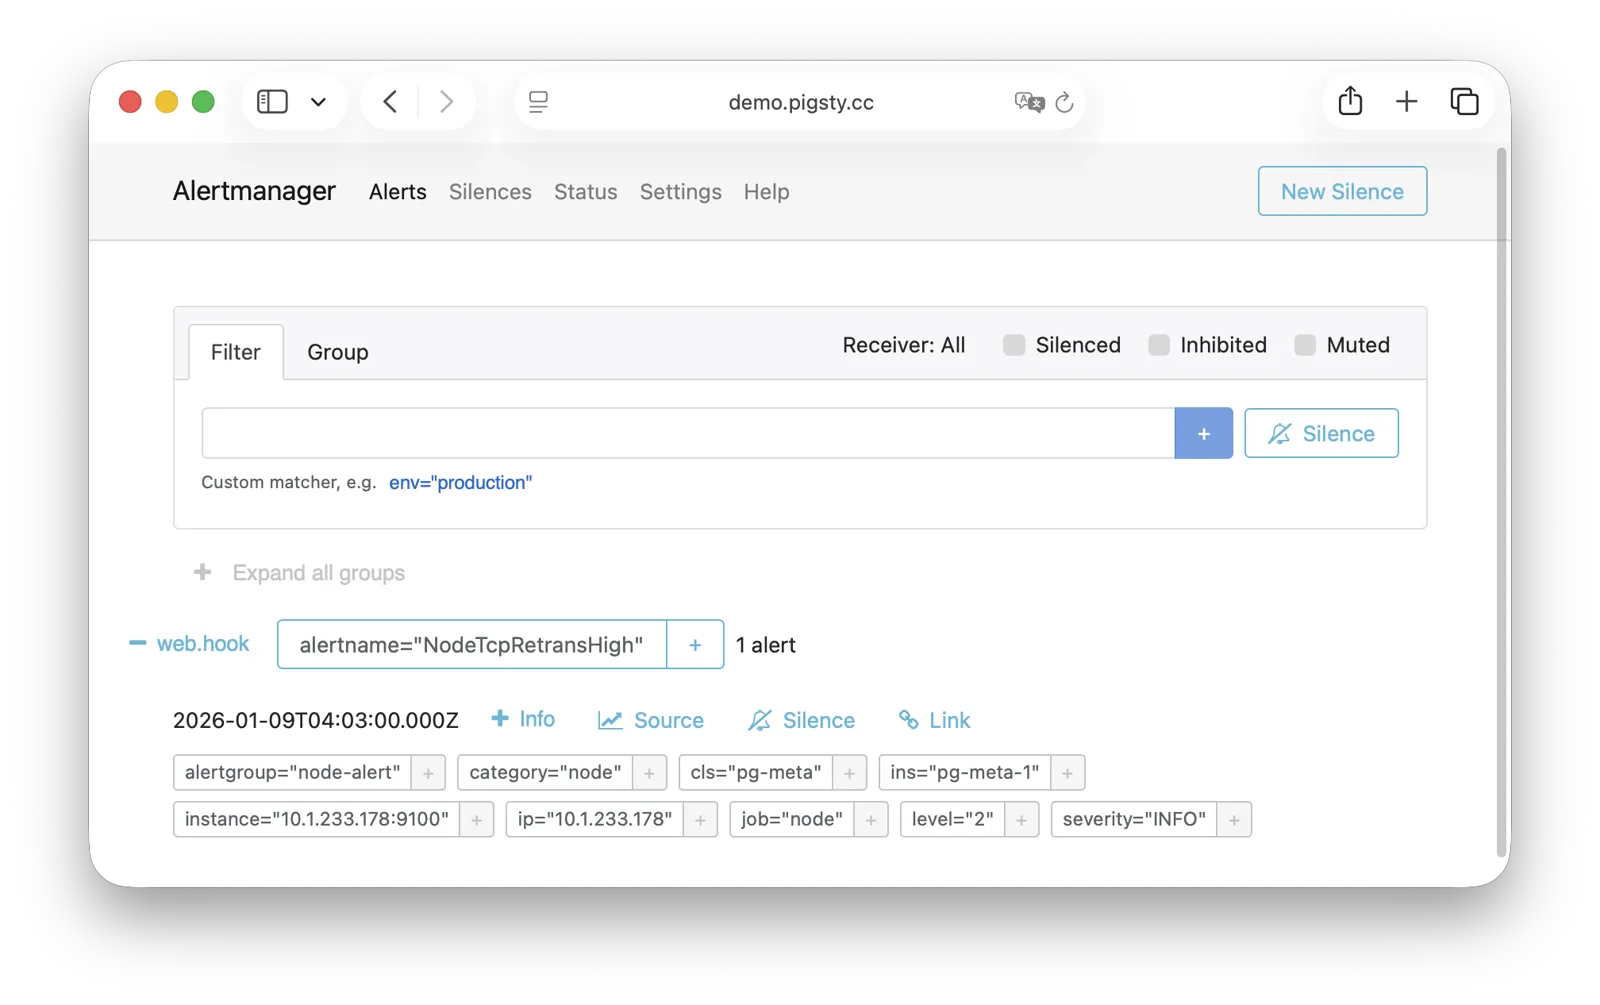
AlertManager
AlertManager 负责告警事件的聚合、去重、分组与分发。在线演示
默认监听 9059 端口,挂载于 Nginx /alertmgr 路径上,亦可通过 a.pigsty 域名直接访问:
| IP访问(替换) | 域名(HTTP) | 域名(HTTPS) | 公开演示 | |
|---|---|---|---|---|
http://10.10.10.10/alertmgr | http://a.pigsty | https://i.pigsty/alertmgr | https://demo.pigsty.cc/alertmgr |
AlertManager 支持多种通知渠道:邮件、Webhook、Slack、PagerDuty、企业微信等。 通过配置告警路由规则,可实现按严重程度、模块类型进行差异化分发,支持静默、抑制等高级功能。
更多信息请参阅:配置:INFRA - AlertManager
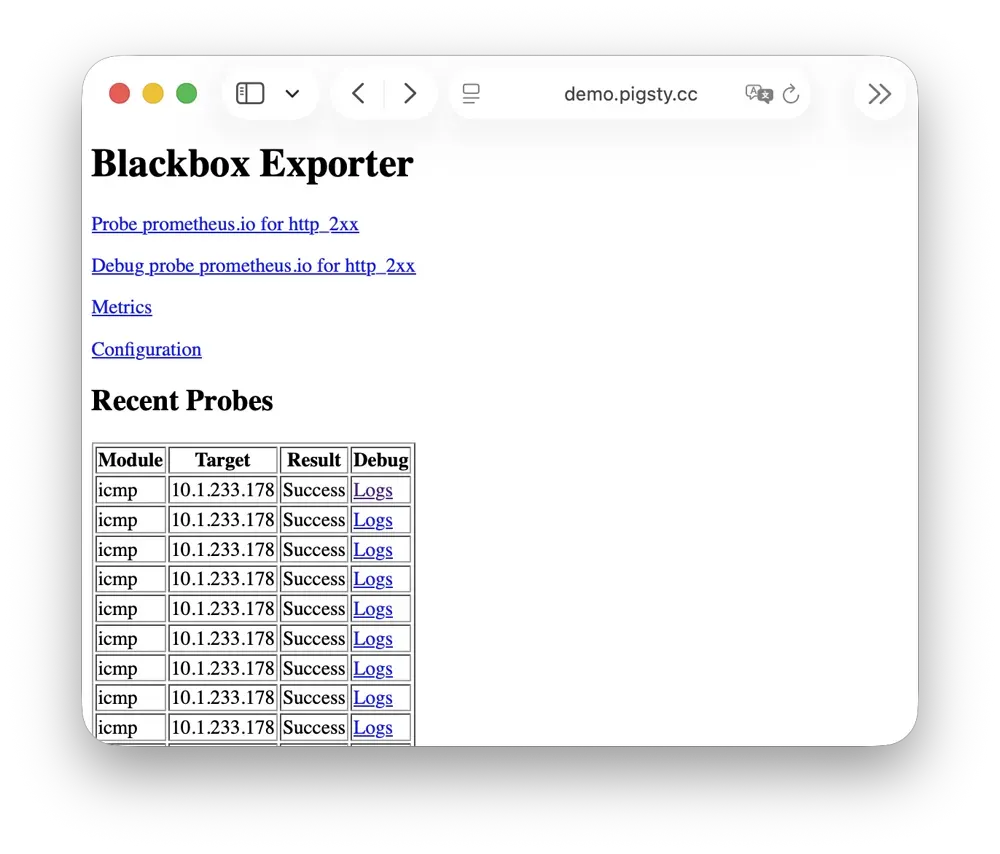
BlackboxExporter
Blackbox Exporter 用于主动探测目标的可达性,实现黑盒监控。
默认监听 9115 端口,挂载于 Nginx /blackbox 路径上:
| IP访问(替换) | 域名(HTTP) | 域名(HTTPS) | 公开演示 | |
|---|---|---|---|---|
http://10.10.10.10/blackbox | http://i.pigsty/blackbox | https://i.pigsty/blackbox | https://demo.pigsty.cc/blackbox |
支持 ICMP Ping、TCP 端口、HTTP/HTTPS 端点等多种探测方式。 可用于监控 VIP 可达性、服务端口存活、外部依赖健康状态等场景,是判断故障影响范围的重要手段。
更多信息请参阅:配置:INFRA - BLACKBOX
Ansible
Ansible 是 Pigsty 的核心编排工具,所有部署、配置、管理操作均通过 Ansible Playbook 完成。
Pigsty 在安装时会自动在管理节点(Infra 节点)上安装 Ansible。 它采用声明式配置风格与幂等剧本设计:同一剧本可重复执行,系统会自动收敛至期望状态,无需担心副作用。
Ansible 的核心优势:
- 无 Agent:通过 SSH 远程执行,无需在目标节点安装额外软件。
- 声明式:描述期望状态,而非执行步骤,配置即文档。
- 幂等性:多次执行结果一致,支持部分失败后重试。
更多信息请参阅:剧本:Pigsty Playbook
DNSMASQ
DNSMASQ 在 INFRA节点 上提供环境内的 DNS 解析服务,将域名解析到对应 IP 地址。
DNSMASQ 默认监听 53 端口(UDP/TCP),为环境内所有节点提供 DNS 解析服务,解析记录位于 的 /infra/hosts 目录中。
其他模块在部署时会自动将域名注册到 INFRA 节点的 DNSMASQ 服务中,您可以按需使用。 DNS 是完全可选的模块,Pigsty 本身不依赖它即可正常运行。 客户端节点可将 INFRA 节点配置为 DNS 服务器,即可通过域名访问各服务,无需记忆 IP 地址。
dns_records: 写入 INFRA 节点的默认解析记录node_dns_servers:为节点配置 DNS 服务器,默认通过admin_ip指向 INFRA 节点。(也可以 不配置)
更多信息请参阅:配置:INFRA - DNS 与 教程:DNS:配置域名解析
Chronyd
Chronyd 提供 NTP 时间同步服务,确保环境内所有节点时钟一致。默认监听 123 端口(UDP),作为环境内的时间源。
时间同步对分布式系统至关重要:日志排查需要时间戳对齐,证书校验依赖时钟准确,PostgreSQL 流复制也对时钟偏移敏感。 在隔离网络环境中,INFRA 节点可作为内部 NTP 服务器,其他节点同步至此。
在 Pigsty 中,默认所有节点都会启动 chonyd 服务用于时间同步。默认使用 pool.ntp.org 公共 NTP 服务器作为上游时间源。
Chronyd 本质上归属 Node 模块 管理,但在网络隔离的环境中,你使用 admin_ip 指向 INFRA 节点上的 Chronyd 服务作为内部时间源。
此时 INFRA节点 上的 Chronyd 服务将充当内部时间同步基础设施的角色。
更多信息请参阅:配置:NODE - TIME
INFRA节点与普通节点
在 Pigsty 中,节点与基础设施的关系是 弱循环依赖:node_monitor → infra → node
NODE模块 本身不依赖 INFRA模块,但节点模块中的监控功能(node_monitor)需要依赖基础设施模块提供的监控平台与服务。
因此,在 infra.yml 和 deploy 剧本中,
采用了一种 “交织部署” 的技术:
- 首先初始化所有 普通节点 上的 NODE模块,但是不配置监控,因为基础设施服务尚未部署完成。
- 然后初始化 INFRA节点 上的 INFRA模块,此时监控已经可用
- 然后回过头来,重新配置所有 普通节点 上的监控功能,连接到已经部署完成的监控平台
如果您不追求 “一次性” 部署所有节点,也可以采用 分阶段部署 的方式,先初始化 INFRA 节点,然后再初始化其他普通节点即可。
节点与基础设施是如何耦合的?
普通节点会通过 admin_ip 参数来引用某个 INFRA节点 作为它们的基础设施提供者。
例如,当你配置了全局的 admin_ip = 10.10.10.10,那么通常意味着所有节点都会使用这个 IP 上的基础设施服务。
这样的设计允许你快速,批量的切换节点的基础设施提供者 —— 以下是 可能 引用 ${admin_ip} 的配置参数列表:
| 参数 | 模块 | 默认值 | 说明 |
|---|---|---|---|
repo_endpoint | INFRA | http://${admin_ip}:80 | 软件仓库访问地址 |
repo_upstream.baseurl | INFRA | http://${admin_ip}/pigsty | 本地软件源 baseurl |
infra_portal.endpoint | INFRA | ${admin_ip}:<port> | Nginx 反向代理后端地址 |
dns_records | INFRA | ["${admin_ip} i.pigsty", ...] | DNS 解析记录 |
node_default_etc_hosts | NODE | ["${admin_ip} i.pigsty"] | 默认静态 DNS 记录 |
node_etc_hosts | NODE | [] | 自定义静态 DNS 记录 |
node_dns_servers | NODE | ["${admin_ip}"] | 动态 DNS 服务器地址 |
node_ntp_servers | NODE | ["pool pool.ntp.org iburst"] | NTP 时间服务器(可选) |
例如,当节点安装软件的时候,local 仓库指向的就是 admin_ip:80/pigsty 上的 Nginx 本地软件仓库。DNS 服务器指向的也是 admin_ip:53 上的 DNSMASQ。
但这并不是强制要求的,例如,节点完全可以忽略并不使用 local 仓库,直接从互联网上游源安装(大部分单机配置模板);DNS 服务器也完全可以不配置与不使用,Pigsty 本身并无对 DNS 服务器的依赖。
INFRA节点与ADMIN节点
通常发起管理的 ADMIN节点 会与基础设施节点(INFRA节点)重合。
在 单机部署 就是这样的。在多节点部署中,如果有多个 INFRA 节点,管理节点通常是 infra 分组中的第一个,其余作为备用。
不过,也有例外存在。您可能会出于各种原因,将两者分离开来:
例如在 大规模生产环境部署 中,一种经典模式是使用 1-2 台归属于 DBA 组的专用管理主机(微型虚拟机即可), 作为整个环境的控制中枢,并使用 2-3 台高配置的物理机(或者更多!),作为整个环境的监控基础设施。这时候管理节点就与基础设施节点分离开来了。 这时候,你在配置文件中填入的 admin_ip 应该指向某个 INFRA 节点的 IP 地址,而不是当前 ADMIN 节点的 IP 地址。 这是因为历史遗留原因:Pigsty 设计之初,ADMIN 节点 与 INFRA 节点 是强绑定的概念,后来才逐渐演化出分离的能力,因此参数名称未做修改。
另一种常见的情况是 本地管理云节点,例如,您可以在自己的笔记本上安装 Ansible,然后填入你的云节点作为 “被管理对象”。 在这种情况下,您的笔记本充当 ADMIN 节点,而云服务器充当 INFRA 节点。
all:
  children:
    infra:   { hosts: { 10.10.10.10: { infra_seq: 1 , ansible_host: your_ssh_alias } } }  # <--- 利用 ansible_host 指向云节点(填入 ssh 别名)
    etcd:    { hosts: { 10.10.10.10: { etcd_seq: 1 } }, vars: { etcd_cluster: etcd } }    # ssh 连接会使用 ssh your_ssh_alias
    pg-meta: { hosts: { 10.10.10.10: { pg_seq: 1, pg_role: primary } }, vars: { pg_cluster: pg-meta } }
  vars:
    version: v4.2.2
    admin_ip: 10.10.10.10
    region: default
多个 INFRA 节点
默认情况下,Pigsty 只需要一个 INFRA 节点即可满足大部分需求。INFRA 模块挂了,也不会影响其他节点上的数据库服务。
但是,在一些对监控与告警要求极高的生产环境中,您可能希望部署多个 INFRA 节点,来提升基础设施的可用性。 一种常见的部署是使用两个 Infra 节点,提供一份冗余副本,并互相监控对方… 或者使用更多,部署分布式的 Victoria 集群实现无限水平扩展。
每个 Infra 节点都是 独立 的,Nginx 指向的都是本机上的服务。 VictoriaMetrics 也是独立抓取环境中所有服务的监控指标, 日志会默认推送到所有 VictoriaLogs 日志采集端点上。 唯一的例外是 Grafana,每一个 Grafana 中都会注册所有的 VictoriaMetrics / Logs / Traces / PostgreSQL 实例作为数据源。 因此每一个 Grafana 实例都能看到完整的监控数据。
如果您对 Grafana 进行修改,例如添加新的仪表板,或者修改数据源配置,这些变更只会影响当前节点上的 Grafana 实例。 如果您希望所有节点上的 Grafana 保持一致,可以使用一个 PostgreSQL 数据库作为共享存储,详情参考 教程:配置 Grafana 高可用。