本文介绍了 Pigsty 的监控系统架构,包括监控指标,日志,与目标管理的方式。以及如何 监控现有PG集群 与远程 RDS服务。
监控概览
Pigsty使用现代的可观测技术栈对 PostgreSQL 进行监控:
- 使用 Grafana 进行指标可视化和 PostgreSQL 数据源。
- 使用 VictoriaMetrics 来采集 PostgreSQL / Pgbouncer / Patroni / HAProxy / Node 的指标
- 使用 VictoriaLogs 来记录 PostgreSQL / Pgbouncer / Patroni / pgBackRest 以及主机组件的日志
- Pigsty 提供了开箱即用的 Grafana 仪表盘,展示与 PostgreSQL 有关的方方面面。
监控指标
PostgreSQL 本身的监控指标完全由 pg_exporter 配置文件所定义:pg_exporter.yml
它将进一步被 Prometheus 记录规则和告警规则进行加工处理:files/prometheus/rules/pgsql.yml。
Pigsty使用三个身份标签:cls、ins、ip,它们将附加到所有指标和日志上。此外,Pgbouncer的监控指标,主机节点 NODE,与负载均衡器的监控指标也会被 Pigsty 所使用,并尽可能地使用相同的标签以便于关联分析。
{ cls: pg-meta, ins: pg-meta-1, ip: 10.10.10.10 }
{ cls: pg-meta, ins: pg-test-1, ip: 10.10.10.11 }
{ cls: pg-meta, ins: pg-test-2, ip: 10.10.10.12 }
{ cls: pg-meta, ins: pg-test-3, ip: 10.10.10.13 }
日志
与 PostgreSQL 有关的日志由 vector 负责收集,并发送至 infra 节点上的 VictoriaLogs 日志存储/查询服务。
pg_log_dir: postgres日志目录,默认为/pg/log/postgrespgbouncer_log_dir: pgbouncer日志目录,默认为/pg/log/pgbouncerpatroni_log_dir: patroni日志目录,默认为/pg/log/patronipgbackrest_log_dir: pgbackrest日志目录,默认为/pg/log/pgbackrest
目标管理
Prometheus的监控目标在 /etc/prometheus/targets/pgsql/ 下的静态文件中定义,每个实例都有一个相应的文件。以 pg-meta-1 为例:
# pg-meta-1 [primary] @ 10.10.10.10
- labels: { cls: pg-meta, ins: pg-meta-1, ip: 10.10.10.10 }
  targets:
    - 10.10.10.10:9630    # <--- pg_exporter 用于PostgreSQL指标
    - 10.10.10.10:9631    # <--- pg_exporter 用于pgbouncer指标
    - 10.10.10.10:8008    # <--- patroni指标(未启用 API SSL 时)
当全局标志 patroni_ssl_enabled 被设置时,patroni目标将被移动到单独的文件 /etc/prometheus/targets/patroni/<ins>.yml。 因为此时使用的是 https 抓取端点。当您 监控RDS 实例时,监控目标会被单独放置于: /etc/prometheus/targets/pgrds/ 目录下,并以集群为单位进行管理。
当使用 bin/pgsql-rm 或 pgsql-rm.yml 移除集群时,Prometheus监控目标将被移除。您也可以手动移除它,或使用剧本里的子任务:
bin/pgmon-rm <cls|ins> # 从所有infra节点中移除 prometheus 监控目标
远程 RDS 监控目标会被放置于 /etc/prometheus/targets/pgrds/<cls>.yml,它们是由 pgsql-monitor.yml 剧本或 bin/pgmon-add 脚本所创建的。
监控模式
Pigsty 提供三种监控模式,以适应不同的监控需求。
| 事项\等级 | L1 | L2 | L3 |
|---|---|---|---|
| 名称 | 基础部署 | 托管部署 | 标准部署 |
| 英文 | RDS | MANAGED | FULL |
| 场景 | 只有连接串,例如RDS | DB已存在,节点可管理 | 实例由 Pigsty 创建 |
| PGCAT功能 | ✅ 完整可用 | ✅ 完整可用 | ✅ 完整可用 |
| PGSQL功能 | ✅ 限PG指标 | ✅ 限PG与节点指标 | ✅ 完整功能 |
| 连接池指标 | ❌ 不可用 | ⚠️ 选装 | ✅ 预装项 |
| 负载均衡器指标 | ❌ 不可用 | ⚠️ 选装 | ✅ 预装项 |
| PGLOG功能 | ❌ 不可用 | ⚠️ 选装 | ✅ 预装项 |
| PG Exporter | ⚠️ 部署于Infra节点 | ✅ 部署于DB节点 | ✅ 部署于DB节点 |
| Node Exporter | ❌ 不部署 | ✅ 部署于DB节点 | ✅ 部署于DB节点 |
| 侵入DB节点 | ✅ 无侵入 | ⚠️ 安装Exporter | ⚠️ 完全由Pigsty管理 |
| 监控现有实例 | ✅ 可支持 | ✅ 可支持 | ❌ 仅用于Pigsty托管实例 |
| 监控用户与视图 | 人工创建 | 人工创建 | Pigsty自动创建 |
| 部署使用剧本 | bin/pgmon-add <cls> | 部分执行 pgsql.ym/node.yml | pgsql.yml |
| 所需权限 | Infra 节点可达的 PGURL | DB节点ssh与sudo权限 | DB节点ssh与sudo权限 |
| 功能概述 | PGCAT + PGRDS | 大部分功能 | 完整功能 |
由Pigsty完全管理的数据库会自动纳入监控,并拥有最好的监控支持,通常不需要任何配置。对于现有的 PostgreSQL 集群或者 RDS 服务,如果如果目标DB节点可以被Pigsty所管理(ssh可达,sudo可用),那么您可以考虑 托管部署,实现与 Pigsty 基本类似的监控管理体验。如果您只能通过PGURL(数据库连接串)的方式访问目标数据库,例如远程的RDS服务,则可以考虑使用 精简模式 监控目标数据库。
监控现有集群
如果目标DB节点可以被Pigsty所管理(ssh可达且sudo可用),那么您可以使用 pgsql.yml 剧本中的pg_exporter任务,
使用与标准部署相同的方式,在目标节点上部署监控组件:PG Exporter。您也可以使用该剧本的 pgbouncer,pgbouncer_exporter 任务在已有实例节点上部署连接池及其监控。此外,您也可以使用 node.yml 中的 node_exporter, haproxy, vector 部署主机监控,负载均衡,日志收集组件。从而获得与原生Pigsty数据库实例完全一致的使用体验。
现有集群的定义方式与 Pigsty 所管理的集群定义方式完全相同,您只是选择性执行 pgsql.yml 剧本中的部分任务,而不是执行整个剧本。
./node.yml  -l <cls> -t node_repo,node_pkg           # 在主机节点上添加 INFRA节点的 YUM 源并安装软件包。
./node.yml  -l <cls> -t node_exporter,node_register  # 配置主机监控,并加入 VictoriaMetrics
./node.yml  -l <cls> -t vector                       # 配置主机日志采集,并发送至 victoria-logs
./pgsql.yml -l <cls> -t pg_exporter,pg_register      # 配置 PostgreSQL 监控,并注册至 Victoria/Grafana
因为目标数据库集群已存在,所以您需要手工在目标数据库集群上 创建监控用户、模式与扩展。
监控RDS
如果您只能通过PGURL(数据库连接串)的方式访问目标数据库,那么可以参照这里的说明进行配置。在这种模式下,Pigsty 在 INFRA节点 上部署对应的 PG Exporter,抓取远端数据库指标信息。如下图所示:
------ infra ------
|                 |
|   prometheus    |            v---- pg-foo-1 ----v
|       ^         |  metrics   |         ^        |
|   pg_exporter <-|------------|----  postgres    |
|   (port: 20001) |            | 10.10.10.10:5432 |
|       ^         |            ^------------------^
|       ^         |                      ^
|       ^         |            v---- pg-foo-2 ----v
|       ^         |  metrics   |         ^        |
|   pg_exporter <-|------------|----  postgres    |
|   (port: 20002) |            | 10.10.10.11:5433 |
-------------------            ^------------------^
在这种模式下,监控系统不会有主机,连接池,负载均衡器,高可用组件的相关指标,但数据库本身,以及数据目录(Catalog)中的实时状态信息仍然可用。Pigsty提供了两个专用的监控面板,专注于 PostgreSQL 本身的监控指标: PGRDS Cluster 与 PGRDS Instance,总览与数据库内监控则复用现有监控面板。因为Pigsty不能管理您的RDS,所以用户需要在目标数据库上提前 配置好监控对象。
- pgBoucner 连接池指标不可用
- Patroni 高可用组件指标不可用
- 主机节点监控指标不可用,以及节点 HAProxy,Keepalived 指标亦不可用。
- 日志收集与日志衍生指标不可用
下面我们使用沙箱环境作为示例:现在我们假设 pg-meta 集群是一个有待监控的 RDS 实例 pg-foo-1,而 pg-test 集群则是一个有待监控的RDS集群 pg-bar:
在目标上创建监控模式、用户和权限。详情请参考 监控对象配置
在配置清单中声明集群。例如,假设我们想要监控“远端”的
pg-meta&pg-test集群:infra: # 代理、监控、警报等的infra集群.. hosts: { 10.10.10.10: { infra_seq: 1 } } vars: # 在组'infra'上为远程postgres RDS安装pg_exporter pg_exporters: # 在此列出所有远程实例,为k分配一个唯一的未使用的本地端口 20001: { pg_cluster: pg-foo, pg_seq: 1, pg_host: 10.10.10.10 , pg_databases: [{ name: meta }] } # 注册 meta 数据库为 Grafana 数据源 20002: { pg_cluster: pg-bar, pg_seq: 1, pg_host: 10.10.10.11 , pg_port: 5432 } # 几种不同的连接串拼接方法 20003: { pg_cluster: pg-bar, pg_seq: 2, pg_host: 10.10.10.12 , pg_exporter_url: 'postgres://dbuser_monitor:DBUser.Monitor@10.10.10.12:5432/postgres?sslmode=disable'} 20004: { pg_cluster: pg-bar, pg_seq: 3, pg_host: 10.10.10.13 , pg_monitor_username: dbuser_monitor, pg_monitor_password: DBUser.Monitor }其中,
pg_databases字段中所列出的数据库,将会被注册至 Grafana 中,成为一个 PostgreSQL 数据源,为 PGCAT 监控面板提供数据支持。如果您不想使用PGCAT,将注册数据库到Grafana中,只需要将pg_databases设置为空数组或直接留空即可。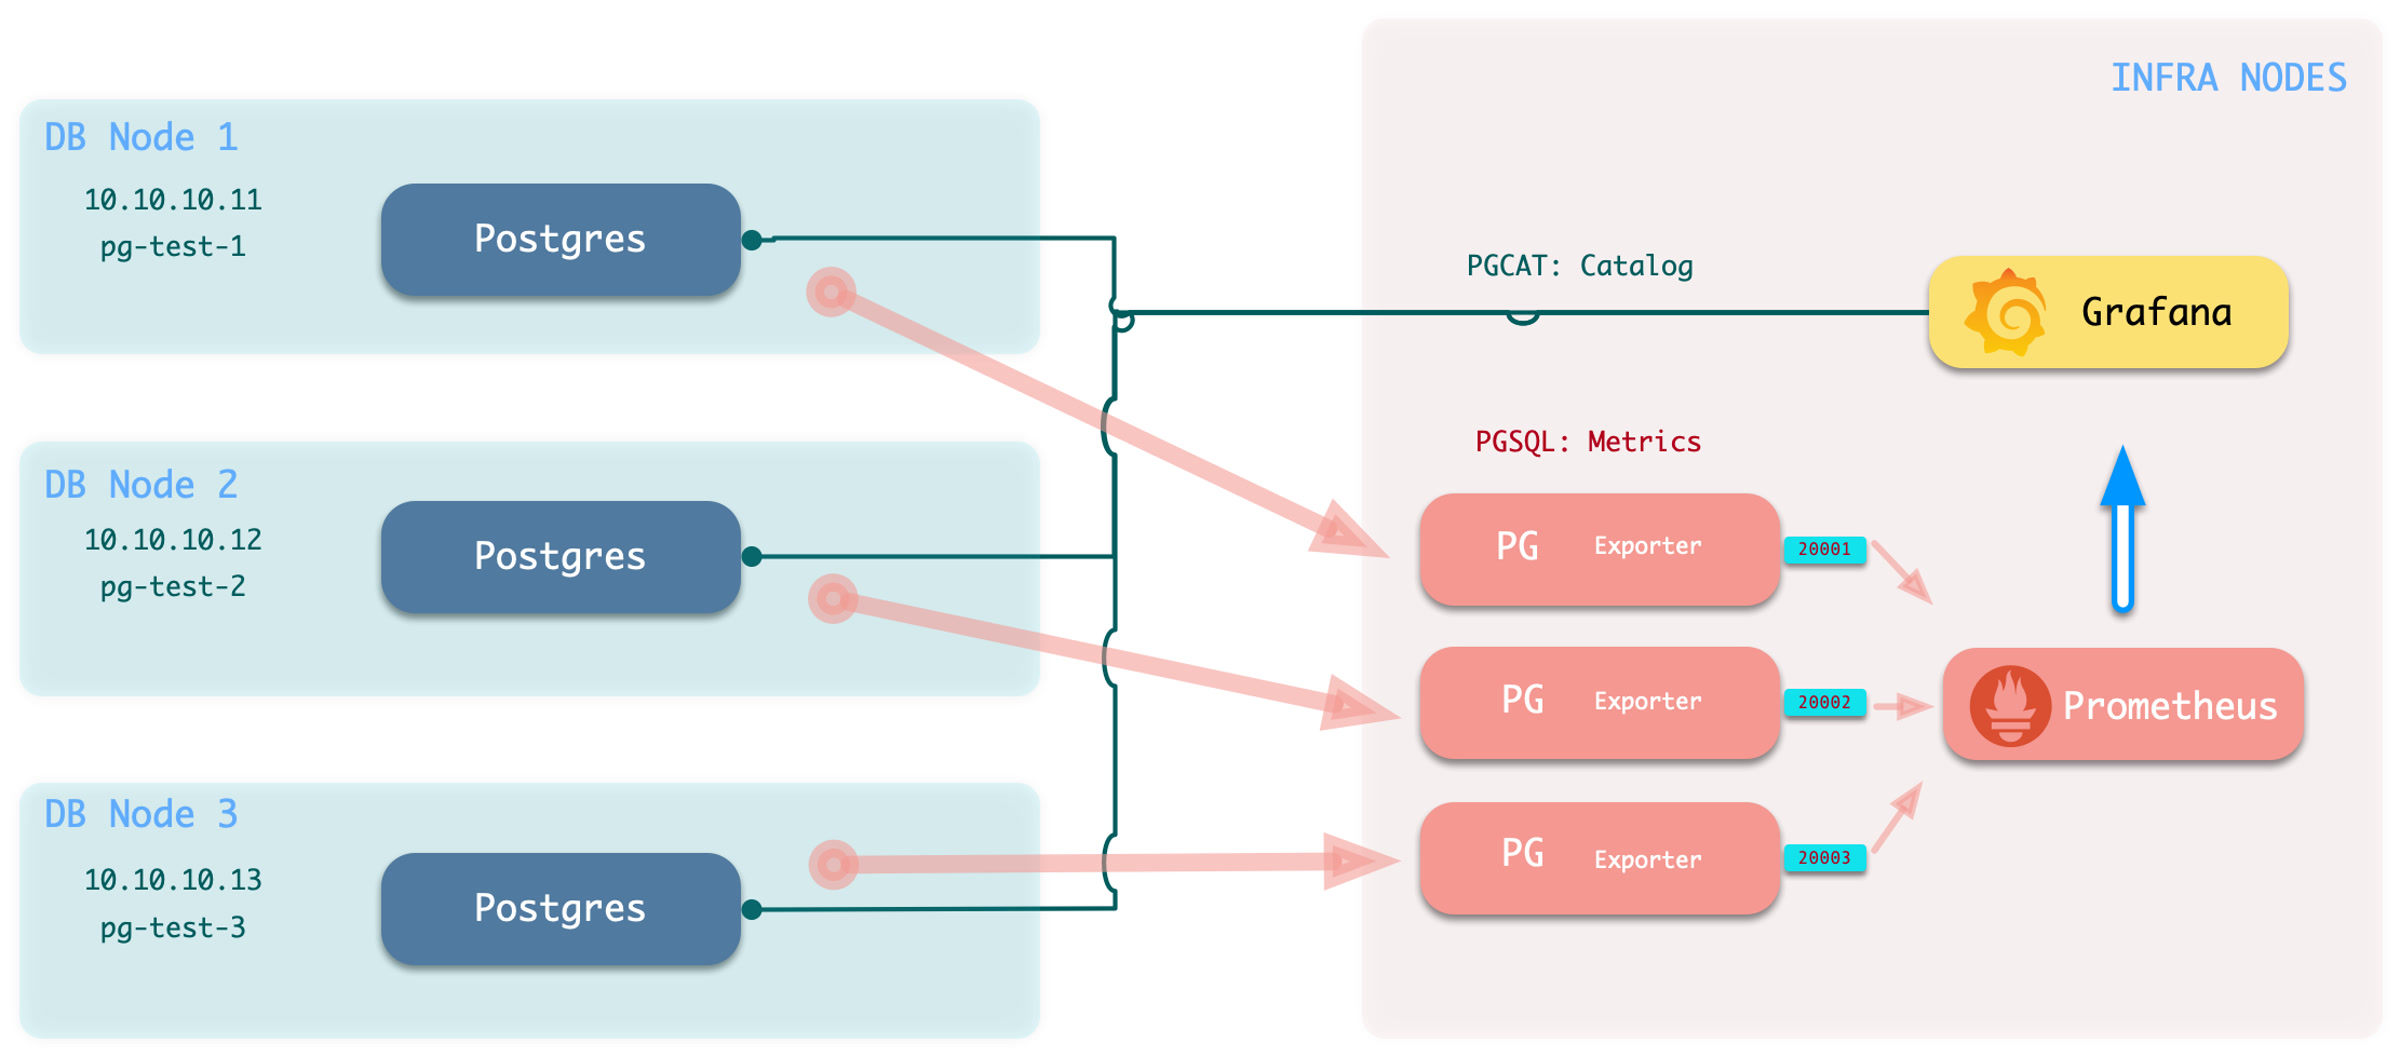
执行添加监控命令:
bin/pgmon-add <clsname>bin/pgmon-add pg-foo # 将 pg-foo 集群纳入监控 bin/pgmon-add pg-bar # 将 pg-bar 集群纳入监控要删除远程集群的监控目标,可以使用
bin/pgmon-rm <clsname>bin/pgmon-rm pg-foo # 将 pg-foo 从 Pigsty 监控中移除 bin/pgmon-rm pg-bar # 将 pg-bar 从 Pigsty 监控中移除
您可以使用更多的参数来覆盖默认 pg_exporter 的选项,下面是一个使用 Pigsty 监控阿里云 RDS 与 PolarDB 的配置样例:
示例:监控阿里云 RDS for PostgreSQL 与 PolarDB
详情请参考:remote.yml
infra:            # 代理、监控、警报等的infra集群..
  hosts: { 10.10.10.10: { infra_seq: 1 } }
  vars:
    pg_exporters:   # 在此列出所有待监控的远程 RDS PG 实例

      20001:        # 分配一个唯一的未使用的本地端口,供本地监控 Agent 使用,这里是一个 PolarDB 的主库
        pg_cluster: pg-polar                  # RDS 集群名 (身份参数,手工指定分配监控系统内名称)
        pg_seq: 1                             # RDS 实例号 (身份参数,手工指定分配监控系统内名称)
        pg_host: pc-2ze379wb1d4irc18x.polardbpg.rds.aliyuncs.com # RDS 主机地址
        pg_port: 1921                         # RDS 端口(从控制台连接信息获取)
        pg_exporter_auto_discovery: true      # 禁用新数据库自动发现功能
        pg_exporter_include_database: 'test'  # 仅监控这个列表中的数据库(多个数据库用逗号分隔)
        pg_monitor_username: dbuser_monitor   # 监控用的用户名,覆盖全局配置
        pg_monitor_password: DBUser_Monitor   # 监控用的密码,覆盖全局配置
        pg_databases: [{ name: test }]        # 希望启用PGCAT的数据库列表,只要name字段即可,register_datasource设置为false则不注册。

      20002:       # 这是一个 PolarDB  从库
        pg_cluster: pg-polar                  # RDS 集群名 (身份参数,手工指定分配监控系统内名称)
        pg_seq: 2                             # RDS 实例号 (身份参数,手工指定分配监控系统内名称)
        pg_host: pe-2ze7tg620e317ufj4.polarpgmxs.rds.aliyuncs.com # RDS 主机地址
        pg_port: 1521                         # RDS 端口(从控制台连接信息获取)
        pg_exporter_auto_discovery: true      # 禁用新数据库自动发现功能
        pg_exporter_include_database: 'test,postgres'  # 仅监控这个列表中的数据库(多个数据库用逗号分隔)
        pg_monitor_username: dbuser_monitor   # 监控用的用户名
        pg_monitor_password: DBUser_Monitor   # 监控用的密码
        pg_databases: [ { name: test } ]        # 希望启用PGCAT的数据库列表,只要name字段即可,register_datasource设置为false则不注册。

      20004: # 这是一个基础版的单节点 RDS for PostgreSQL 实例
        pg_cluster: pg-rds                    # RDS 集群名 (身份参数,手工指定分配监控系统内名称)
        pg_seq: 1                             # RDS 实例号 (身份参数,手工指定分配监控系统内名称)
        pg_host: pgm-2zern3d323fe9ewk.pg.rds.aliyuncs.com  # RDS 主机地址
        pg_port: 5432                         # RDS 端口(从控制台连接信息获取)
        pg_exporter_auto_discovery: true      # 禁用新数据库自动发现功能
        pg_exporter_include_database: 'rds'   # 仅监控这个列表中的数据库(多个数据库用逗号分隔)
        pg_monitor_username: dbuser_monitor   # 监控用的用户名
        pg_monitor_password: DBUser_Monitor   # 监控用的密码
        pg_databases: [ { name: rds } ]       # 希望启用PGCAT的数据库列表,只要name字段即可,register_datasource设置为false则不注册。

      20005: # 这是一个高可用版的 RDS for PostgreSQL 集群主库
        pg_cluster: pg-rdsha                  # RDS 集群名 (身份参数,手工指定分配监控系统内名称)
        pg_seq: 1                             # RDS 实例号 (身份参数,手工指定分配监控系统内名称)
        pg_host: pgm-2ze3d35d27bq08wu.pg.rds.aliyuncs.com  # RDS 主机地址
        pg_port: 5432                         # RDS 端口(从控制台连接信息获取)
        pg_exporter_include_database: 'rds'   # 仅监控这个列表中的数据库(多个数据库用逗号分隔)
        pg_databases: [ { name: rds }, {name : test} ]  # 将这两个数据库纳入 PGCAT 管理,注册为 Grafana 数据源

      20006: # 这是一个高可用版的 RDS for PostgreSQL 集群只读实例(从库)
        pg_cluster: pg-rdsha                  # RDS 集群名 (身份参数,手工指定分配监控系统内名称)
        pg_seq: 2                             # RDS 实例号 (身份参数,手工指定分配监控系统内名称)
        pg_host: pgr-2zexqxalk7d37edt.pg.rds.aliyuncs.com  # RDS 主机地址
        pg_port: 5432                         # RDS 端口(从控制台连接信息获取)
        pg_exporter_include_database: 'rds'   # 仅监控这个列表中的数据库(多个数据库用逗号分隔)
        pg_databases: [ { name: rds }, {name : test} ]  # 将这两个数据库纳入 PGCAT 管理,注册为 Grafana 数据源
监控对象配置
当您想要监控现有实例时,不论是 RDS,还是自建的 PostgreSQL 实例,您都需要在目标数据库上进行一些配置,以便 Pigsty 可以访问它们。
为了将外部现存PostgreSQL实例纳入监控,您需要有一个可用于访问该实例/集群的连接串。任何可达连接串(业务用户,超级用户)均可使用,但我们建议使用一个专用监控用户以避免权限泄漏。
- 监控用户:默认使用的用户名为
dbuser_monitor, 该用户属于pg_monitor角色组,或确保具有相关视图访问权限。 - 监控认证:默认使用密码访问,您需要确保HBA策略允许监控用户从管理机或DB节点本地访问数据库。
- 监控模式:固定使用名称
monitor,用于安装额外的监控视图与扩展插件,非必选,但建议创建。 - 监控扩展:强烈建议启用PG自带的监控扩展
pg_stat_statements。 - 监控视图:监控视图是可选项,可以提供更多的监控指标支持。
监控用户
以Pigsty默认使用的监控用户dbuser_monitor为例,在目标数据库集群创建以下用户。
CREATE USER dbuser_monitor;                                       -- 创建监控用户
COMMENT ON ROLE dbuser_monitor IS 'system monitor user';          -- 监控用户备注
GRANT pg_monitor TO dbuser_monitor;                               -- 授予监控用户 pg_monitor 权限,否则一些指标将无法采集

ALTER USER dbuser_monitor PASSWORD 'DBUser.Monitor';              -- 按需修改监控用户密码(强烈建议修改!但请与Pigsty配置一致)
ALTER USER dbuser_monitor SET log_min_duration_statement = 1000;  -- 建议设置此参数,避免日志塞满监控慢查询
ALTER USER dbuser_monitor SET search_path = monitor,public;       -- 建议设置此参数,避免 pg_stat_statements 扩展无法生效
请注意,这里创建的监控用户与密码需要与 pg_monitor_username 与 pg_monitor_password 保持一致。
监控认证
配置数据库 pg_hba.conf 文件,添加以下规则以允许监控用户从本地,以及管理机使用密码访问所有数据库。
# allow local role monitor with password
local   all  dbuser_monitor                    md5
host    all  dbuser_monitor  127.0.0.1/32      md5
host    all  dbuser_monitor  <管理机器IP地址>/32 md5
如果您的 RDS 不支持定义 HBA,那么把安装 Pigsty 机器的内网 IP 地址开白即可。
监控模式
监控模式可选项,即使没有,Pigsty监控系统的主体也可以正常工作,但我们强烈建议设置此模式。
CREATE SCHEMA IF NOT EXISTS monitor;               -- 创建监控专用模式
GRANT USAGE ON SCHEMA monitor TO dbuser_monitor;   -- 允许监控用户使用
监控扩展
监控扩展是可选项,但我们强烈建议启用 pg_stat_statements 扩展该扩展提供了关于查询性能的重要数据。
注意:该扩展必须列入数据库参数 shared_preload_libraries 中方可生效,而修改该参数需要重启数据库。
CREATE EXTENSION IF NOT EXISTS "pg_stat_statements" WITH SCHEMA "monitor";
请注意,您应当在默认的管理数据库 postgres 中安装此扩展。有些时候,RDS不允许您在 postgres 数据库中创建监控模式,
在这种情况下,您可以将 pg_stat_statements 插件安装到默认的 public 下,只要确保监控用户的 search_path 按照上面的配置,能够找到 pg_stat_statements 视图即可。
CREATE EXTENSION IF NOT EXISTS "pg_stat_statements";
ALTER USER dbuser_monitor SET search_path = monitor,public; -- 建议设置此参数,避免 pg_stat_statements 扩展无法生效
监控视图
监控视图提供了若干常用的预处理结果,并对某些需要高权限的监控指标进行权限封装(例如共享内存分配),便于查询与使用。强烈建议在所有需要监控的数据库中创建
监控模式与监控视图定义
----------------------------------------------------------------------
-- Table bloat estimate : monitor.pg_table_bloat
----------------------------------------------------------------------
DROP VIEW IF EXISTS monitor.pg_table_bloat CASCADE;
CREATE OR REPLACE VIEW monitor.pg_table_bloat AS
SELECT CURRENT_CATALOG AS datname, nspname, relname , tblid , bs * tblpages AS size,
       CASE WHEN tblpages - est_tblpages_ff > 0 THEN (tblpages - est_tblpages_ff)/tblpages::FLOAT ELSE 0 END AS ratio
FROM (
         SELECT ceil( reltuples / ( (bs-page_hdr)*fillfactor/(tpl_size*100) ) ) + ceil( toasttuples / 4 ) AS est_tblpages_ff,
                tblpages, fillfactor, bs, tblid, nspname, relname, is_na
         FROM (
                  SELECT
                      ( 4 + tpl_hdr_size + tpl_data_size + (2 * ma)
                          - CASE WHEN tpl_hdr_size % ma = 0 THEN ma ELSE tpl_hdr_size % ma END
                          - CASE WHEN ceil(tpl_data_size)::INT % ma = 0 THEN ma ELSE ceil(tpl_data_size)::INT % ma END
                          ) AS tpl_size, (heappages + toastpages) AS tblpages, heappages,
                      toastpages, reltuples, toasttuples, bs, page_hdr, tblid, nspname, relname, fillfactor, is_na
                  FROM (
                           SELECT
                               tbl.oid AS tblid, ns.nspname , tbl.relname, tbl.reltuples,
                               tbl.relpages AS heappages, coalesce(toast.relpages, 0) AS toastpages,
                               coalesce(toast.reltuples, 0) AS toasttuples,
                               coalesce(substring(array_to_string(tbl.reloptions, ' ') FROM 'fillfactor=([0-9]+)')::smallint, 100) AS fillfactor,
                               current_setting('block_size')::numeric AS bs,
                               CASE WHEN version()~'mingw32' OR version()~'64-bit|x86_64|ppc64|ia64|amd64' THEN 8 ELSE 4 END AS ma,
                               24 AS page_hdr,
                               23 + CASE WHEN MAX(coalesce(s.null_frac,0)) > 0 THEN ( 7 + count(s.attname) ) / 8 ELSE 0::int END
                                   + CASE WHEN bool_or(att.attname = 'oid' and att.attnum < 0) THEN 4 ELSE 0 END AS tpl_hdr_size,
                               sum( (1-coalesce(s.null_frac, 0)) * coalesce(s.avg_width, 0) ) AS tpl_data_size,
                               bool_or(att.atttypid = 'pg_catalog.name'::regtype)
                                   OR sum(CASE WHEN att.attnum > 0 THEN 1 ELSE 0 END) <> count(s.attname) AS is_na
                           FROM pg_attribute AS att
                                    JOIN pg_class AS tbl ON att.attrelid = tbl.oid
                                    JOIN pg_namespace AS ns ON ns.oid = tbl.relnamespace
                                    LEFT JOIN pg_stats AS s ON s.schemaname=ns.nspname AND s.tablename = tbl.relname AND s.inherited=false AND s.attname=att.attname
                                    LEFT JOIN pg_class AS toast ON tbl.reltoastrelid = toast.oid
                           WHERE NOT att.attisdropped AND tbl.relkind = 'r' AND nspname NOT IN ('pg_catalog','information_schema')
                           GROUP BY 1,2,3,4,5,6,7,8,9,10
                       ) AS s
              ) AS s2
     ) AS s3
WHERE NOT is_na;
COMMENT ON VIEW monitor.pg_table_bloat IS 'postgres table bloat estimate';

GRANT SELECT ON monitor.pg_table_bloat TO pg_monitor;

----------------------------------------------------------------------
-- Index bloat estimate : monitor.pg_index_bloat
----------------------------------------------------------------------
DROP VIEW IF EXISTS monitor.pg_index_bloat CASCADE;
CREATE OR REPLACE VIEW monitor.pg_index_bloat AS
SELECT CURRENT_CATALOG AS datname, nspname, idxname AS relname, tblid, idxid, relpages::BIGINT * bs AS size,
       COALESCE((relpages - ( reltuples * (6 + ma - (CASE WHEN index_tuple_hdr % ma = 0 THEN ma ELSE index_tuple_hdr % ma END)
                                               + nulldatawidth + ma - (CASE WHEN nulldatawidth % ma = 0 THEN ma ELSE nulldatawidth % ma END))
                                  / (bs - pagehdr)::FLOAT  + 1 )), 0) / relpages::FLOAT AS ratio
FROM (
         SELECT nspname,idxname,indrelid AS tblid,indexrelid AS idxid,
                reltuples,relpages,
                current_setting('block_size')::INTEGER                                                               AS bs,
                (CASE WHEN version() ~ 'mingw32' OR version() ~ '64-bit|x86_64|ppc64|ia64|amd64' THEN 8 ELSE 4 END)  AS ma,
                24                                                                                                   AS pagehdr,
                (CASE WHEN max(COALESCE(pg_stats.null_frac, 0)) = 0 THEN 2 ELSE 6 END)                               AS index_tuple_hdr,
                sum((1.0 - COALESCE(pg_stats.null_frac, 0.0)) *
                    COALESCE(pg_stats.avg_width, 1024))::INTEGER                                                     AS nulldatawidth
         FROM pg_attribute
                  JOIN (
             SELECT pg_namespace.nspname,
                    ic.relname                                                   AS idxname,
                    ic.reltuples,
                    ic.relpages,
                    pg_index.indrelid,
                    pg_index.indexrelid,
                    tc.relname                                                   AS tablename,
                    regexp_split_to_table(pg_index.indkey::TEXT, ' ') :: INTEGER AS attnum,
                    pg_index.indexrelid                                          AS index_oid
             FROM pg_index
                      JOIN pg_class ic ON pg_index.indexrelid = ic.oid
                      JOIN pg_class tc ON pg_index.indrelid = tc.oid
                      JOIN pg_namespace ON pg_namespace.oid = ic.relnamespace
                      JOIN pg_am ON ic.relam = pg_am.oid
             WHERE pg_am.amname = 'btree' AND ic.relpages > 0 AND nspname NOT IN ('pg_catalog', 'information_schema')
         ) ind_atts ON pg_attribute.attrelid = ind_atts.indexrelid AND pg_attribute.attnum = ind_atts.attnum
                  JOIN pg_stats ON pg_stats.schemaname = ind_atts.nspname
             AND ((pg_stats.tablename = ind_atts.tablename AND pg_stats.attname = pg_get_indexdef(pg_attribute.attrelid, pg_attribute.attnum, TRUE))
                 OR (pg_stats.tablename = ind_atts.idxname AND pg_stats.attname = pg_attribute.attname))
         WHERE pg_attribute.attnum > 0
         GROUP BY 1, 2, 3, 4, 5, 6
     ) est;
COMMENT ON VIEW monitor.pg_index_bloat IS 'postgres index bloat estimate (btree-only)';

GRANT SELECT ON monitor.pg_index_bloat TO pg_monitor;

----------------------------------------------------------------------
-- Relation Bloat : monitor.pg_bloat
----------------------------------------------------------------------
DROP VIEW IF EXISTS monitor.pg_bloat CASCADE;
CREATE OR REPLACE VIEW monitor.pg_bloat AS
SELECT coalesce(ib.datname, tb.datname)                                                   AS datname,
       coalesce(ib.nspname, tb.nspname)                                                   AS nspname,
       coalesce(ib.tblid, tb.tblid)                                                       AS tblid,
       coalesce(tb.nspname || '.' || tb.relname, ib.nspname || '.' || ib.tblid::RegClass) AS tblname,
       tb.size                                                                            AS tbl_size,
       CASE WHEN tb.ratio < 0 THEN 0 ELSE round(tb.ratio::NUMERIC, 6) END                 AS tbl_ratio,
       (tb.size * (CASE WHEN tb.ratio < 0 THEN 0 ELSE tb.ratio::NUMERIC END)) ::BIGINT    AS tbl_wasted,
       ib.idxid,
       ib.nspname || '.' || ib.relname                                                    AS idxname,
       ib.size                                                                            AS idx_size,
       CASE WHEN ib.ratio < 0 THEN 0 ELSE round(ib.ratio::NUMERIC, 5) END                 AS idx_ratio,
       (ib.size * (CASE WHEN ib.ratio < 0 THEN 0 ELSE ib.ratio::NUMERIC END)) ::BIGINT    AS idx_wasted
FROM monitor.pg_index_bloat ib
         FULL OUTER JOIN monitor.pg_table_bloat tb ON ib.tblid = tb.tblid;

COMMENT ON VIEW monitor.pg_bloat IS 'postgres relation bloat detail';
GRANT SELECT ON monitor.pg_bloat TO pg_monitor;

----------------------------------------------------------------------
-- monitor.pg_index_bloat_human
----------------------------------------------------------------------
DROP VIEW IF EXISTS monitor.pg_index_bloat_human CASCADE;
CREATE OR REPLACE VIEW monitor.pg_index_bloat_human AS
SELECT idxname                            AS name,
       tblname,
       idx_wasted                         AS wasted,
       pg_size_pretty(idx_size)           AS idx_size,
       round(100 * idx_ratio::NUMERIC, 2) AS idx_ratio,
       pg_size_pretty(idx_wasted)         AS idx_wasted,
       pg_size_pretty(tbl_size)           AS tbl_size,
       round(100 * tbl_ratio::NUMERIC, 2) AS tbl_ratio,
       pg_size_pretty(tbl_wasted)         AS tbl_wasted
FROM monitor.pg_bloat
WHERE idxname IS NOT NULL;
COMMENT ON VIEW monitor.pg_index_bloat_human IS 'postgres index bloat info in human-readable format';
GRANT SELECT ON monitor.pg_index_bloat_human TO pg_monitor;


----------------------------------------------------------------------
-- monitor.pg_table_bloat_human
----------------------------------------------------------------------
DROP VIEW IF EXISTS monitor.pg_table_bloat_human CASCADE;
CREATE OR REPLACE VIEW monitor.pg_table_bloat_human AS
SELECT tblname                                          AS name,
       idx_wasted + tbl_wasted                          AS wasted,
       pg_size_pretty(idx_wasted + tbl_wasted)          AS all_wasted,
       pg_size_pretty(tbl_wasted)                       AS tbl_wasted,
       pg_size_pretty(tbl_size)                         AS tbl_size,
       tbl_ratio,
       pg_size_pretty(idx_wasted)                       AS idx_wasted,
       pg_size_pretty(idx_size)                         AS idx_size,
       round(idx_wasted::NUMERIC * 100.0 / idx_size, 2) AS idx_ratio
FROM (SELECT datname,
             nspname,
             tblname,
             coalesce(max(tbl_wasted), 0)                         AS tbl_wasted,
             coalesce(max(tbl_size), 1)                           AS tbl_size,
             round(100 * coalesce(max(tbl_ratio), 0)::NUMERIC, 2) AS tbl_ratio,
             coalesce(sum(idx_wasted), 0)                         AS idx_wasted,
             coalesce(sum(idx_size), 1)                           AS idx_size
      FROM monitor.pg_bloat
      WHERE tblname IS NOT NULL
      GROUP BY 1, 2, 3
     ) d;
COMMENT ON VIEW monitor.pg_table_bloat_human IS 'postgres table bloat info in human-readable format';
GRANT SELECT ON monitor.pg_table_bloat_human TO pg_monitor;


----------------------------------------------------------------------
-- Activity Overview: monitor.pg_session
----------------------------------------------------------------------
DROP VIEW IF EXISTS monitor.pg_session CASCADE;
CREATE OR REPLACE VIEW monitor.pg_session AS
SELECT coalesce(datname, 'all') AS datname, numbackends, active, idle, ixact, max_duration, max_tx_duration, max_conn_duration
FROM (
         SELECT datname,
                count(*)                                         AS numbackends,
                count(*) FILTER ( WHERE state = 'active' )       AS active,
                count(*) FILTER ( WHERE state = 'idle' )         AS idle,
                count(*) FILTER ( WHERE state = 'idle in transaction'
                    OR state = 'idle in transaction (aborted)' ) AS ixact,
                max(extract(epoch from now() - state_change))
                FILTER ( WHERE state = 'active' )                AS max_duration,
                max(extract(epoch from now() - xact_start))      AS max_tx_duration,
                max(extract(epoch from now() - backend_start))   AS max_conn_duration
         FROM pg_stat_activity
         WHERE backend_type = 'client backend'
           AND pid <> pg_backend_pid()
         GROUP BY ROLLUP (1)
         ORDER BY 1 NULLS FIRST
     ) t;
COMMENT ON VIEW monitor.pg_session IS 'postgres activity group by session';
GRANT SELECT ON monitor.pg_session TO pg_monitor;


----------------------------------------------------------------------
-- Sequential Scan: monitor.pg_seq_scan
----------------------------------------------------------------------
DROP VIEW IF EXISTS monitor.pg_seq_scan CASCADE;
CREATE OR REPLACE VIEW monitor.pg_seq_scan AS
SELECT schemaname                                                        AS nspname,
       relname,
       seq_scan,
       seq_tup_read,
       seq_tup_read / seq_scan                                           AS seq_tup_avg,
       idx_scan,
       n_live_tup + n_dead_tup                                           AS tuples,
       round(n_live_tup * 100.0::NUMERIC / (n_live_tup + n_dead_tup), 2) AS live_ratio
FROM pg_stat_user_tables
WHERE seq_scan > 0
  and (n_live_tup + n_dead_tup) > 0
ORDER BY seq_scan DESC;
COMMENT ON VIEW monitor.pg_seq_scan IS 'table that have seq scan';
GRANT SELECT ON monitor.pg_seq_scan TO pg_monitor;
查看共享内存分配的函数(PG13以上可用)
DROP FUNCTION IF EXISTS monitor.pg_shmem() CASCADE;
CREATE OR REPLACE FUNCTION monitor.pg_shmem() RETURNS SETOF
    pg_shmem_allocations AS $$ SELECT * FROM pg_shmem_allocations;$$ LANGUAGE SQL SECURITY DEFINER;
COMMENT ON FUNCTION monitor.pg_shmem() IS 'security wrapper for system view pg_shmem';
REVOKE ALL ON FUNCTION monitor.pg_shmem() FROM PUBLIC;
GRANT EXECUTE ON FUNCTION monitor.pg_shmem() TO pg_monitor;